
ACoS vs ROAS: Which Number to Trust
ACoS vs ROAS: Which Number to Trust


The most popular advice about ACoS vs ROAS is to pick a healthy benchmark and optimize toward it. That's how advertisers end up scaling campaigns that look efficient in the platform and lose money on every order. Changing the metric won't fix that.
Trust neither number without a contribution-margin target and a clear view of attribution. Your first question is whether the sale leaves enough money to pay for advertising. Your next question is whether the ad created demand or collected credit for demand you already had. Everything else is reporting preference.
ACoS vs ROAS Side by Side
Spend $50 to generate $100 in attributed sales, and you get 50% ACoS and 2.0 ROAS, meaning two dollars of revenue per ad dollar, using the definitions in Amazon's advertising cost of sales guide. Both describe the same transaction. They put a different number in the numerator.
ACoS, or advertising cost of sales, describes the share of attributed revenue consumed by advertising. ROAS, or return on ad spend, describes the attributed revenue generated per advertising dollar.
ACoS and ROAS on the same sale
| Label | Formula | Better direction | On $50 spend and $100 sales | Usual home |
|---|---|---|---|---|
| ACoS | (Ad spend ÷ ad revenue) × 100 | Lower | 50% | Amazon Ads |
| ROAS | Ad revenue ÷ ad spend | Higher | 2.0 | Google Ads and most other ad platforms |
| Inverse pair, strong | ACoS = 1 ÷ ROAS as a percent | Same result, opposite reading | ROAS 4.0 equals 25% ACoS | Either report |
| Inverse pair, weak | ACoS = 1 ÷ ROAS as a percent | Same result, opposite reading | ROAS 1.25 equals 80% ACoS | Either report |
The inverse pairs are arithmetic conversions, not different performance outcomes. The strong and weak labels describe relative advertising efficiency, not whether either result makes money for your business.
This side-by-side view keeps the spend and sale constant.
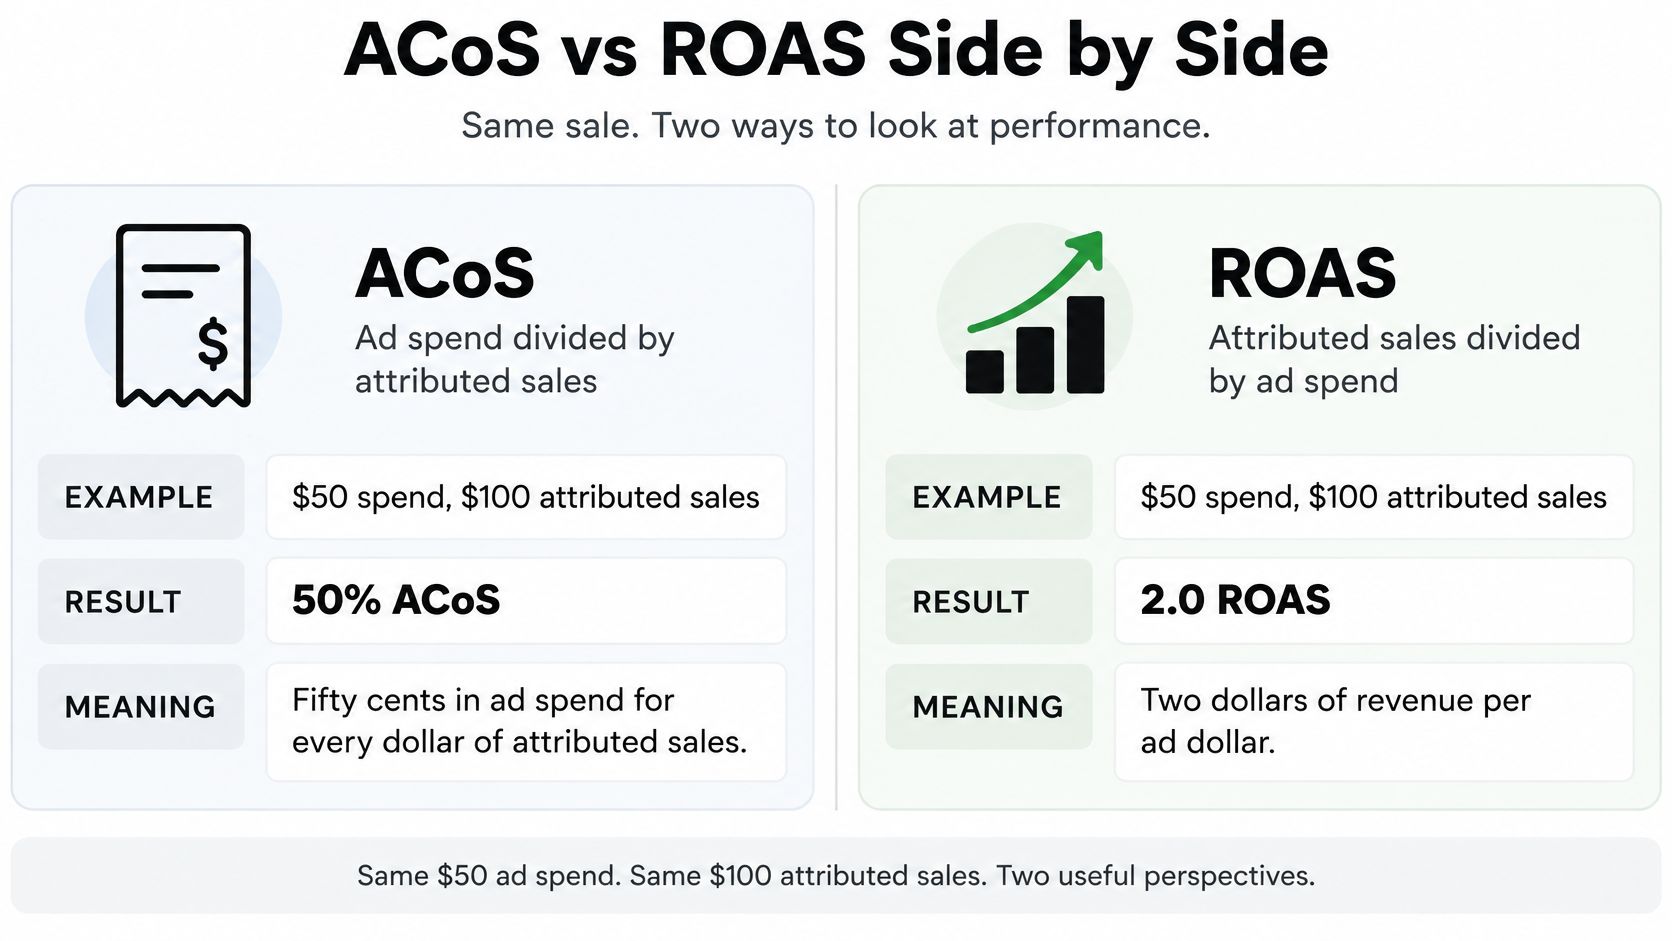
Translate the report, not the strategy
If your Amazon specialist reports ACoS and your Google Ads specialist reports ROAS, agree on a common reporting convention. Otherwise, you'll spend account reviews translating percentages into multiples instead of discussing what to change.
Use the return on ad spend formula to standardize the calculation. Keep the revenue basis consistent too. Don't compare one report using net sales after refunds with another using gross order value and call the difference a channel advantage.
There's no extra insight hidden in the reciprocal. You can't improve a campaign by choosing the version that sounds more impressive.
Advertising efficiency isn't profit
Neither metric subtracts product costs, fulfillment, agency fees, discounts, taxes, or returns. A campaign can generate plenty of attributed revenue while leaving too little money to cover those costs.
ROI is a separate calculation. Google's ROI guidance distinguishes it from advertising efficiency by using revenue minus cost of goods sold, divided by cost of goods sold. That's a different question from how much revenue a media dollar received credit for.
Reporting rule: Use ACoS and ROAS to describe advertising efficiency. Use your cost structure to decide whether that efficiency is acceptable.
Track performance at the search-term, keyword, ad-group, and campaign levels. But don't put a green status next to any of them until you've connected the result to margin.
Break-Even Targets From Margin
Your break-even ACoS equals your contribution margin before advertising. Your break-even ROAS equals the reciprocal of that margin, the approach discussed in Epinium's guide to looking beyond ACoS. The following thresholds are calculated from those rules, with recurring decimals rounded for readability.
Break-even ACoS and ROAS by contribution margin
| Contribution margin | Break-even ACoS | Break-even ROAS | How to read a result |
|---|---|---|---|
| 20% | 20% | 5.0 | Spend above 20 cents per sales dollar wipes the contribution |
| 30% | 30% | 3.33 | A 4.0 ROAS still clears this gate |
| 40% | 40% | 2.5 | A 25% ACoS is profitable here |
| 50% | 50% | 2.0 | The $50 spend and $100 sale example sits exactly on the line |
| 60% | 60% | 1.67 | More contribution is available to fund acquisition |
These are break-even boundaries, not recommended operating targets. If you want advertising to leave a profit contribution, set the ACoS ceiling below break-even or the ROAS floor above it. Don't treat a rounded figure as permission to spend the last available cent.
Build the margin before setting the target
Start with revenue you expect to retain. Subtract product cost, shipping subsidies, fulfillment, expected refunds, applicable taxes, and allocated agency fees or other non-media selling costs. Don't deduct advertising here, because advertising is the expense you're solving for.
Say a product sells for $40, with $24 in non-ad costs. In this hypothetical example, you retain $16, a 40% contribution margin, before advertising. Spending more than 40 cents per sales dollar on ads would consume that contribution.
At 25% ACoS, that hypothetical order uses $10 of advertising and leaves $6 after the specified costs. Give the same advertising result to a product with thinner contribution, and the order can lose money. The platform's efficiency number hasn't changed. The economics have.
That's why a blended account target can be dangerous for a mixed catalogue. A high-margin product can subsidize a low-margin one inside the same campaign report, leaving the buyer with no obvious warning.
Make the gate usable
A margin calculation buried in a finance spreadsheet won't influence bids. Put the applicable threshold where your PPC team makes decisions.
- Product grouping: Separate products with materially different contribution margins instead of forcing them into one target.
- Cost ownership: Have finance or the business owner approve the cost inputs. The media buyer shouldn't have to guess fulfillment expense.
- Profit allowance: Record the contribution you want to retain after advertising, not just the maximum you could spend.
- Refresh triggers: Recalculate when pricing, promotions, shipping costs, or refund patterns change.
Agencies and small shops can both make the same mistake: scaling a campaign because the interface looks healthy while the order loses money. Apply the gate to the product being sold, then inspect the keywords and search terms responsible for that sale.
Amazon Ads Versus Google Ads
The formula is shared. The attributed revenue isn't necessarily comparable. Amazon sellers usually work in ACoS because Sponsored Products reporting connects advertising spend with attributed product sales. Google Ads teams generally work in ROAS or conversion value divided by cost.
The platform distinction is easier to see when you separate attributed sales from total business sales.
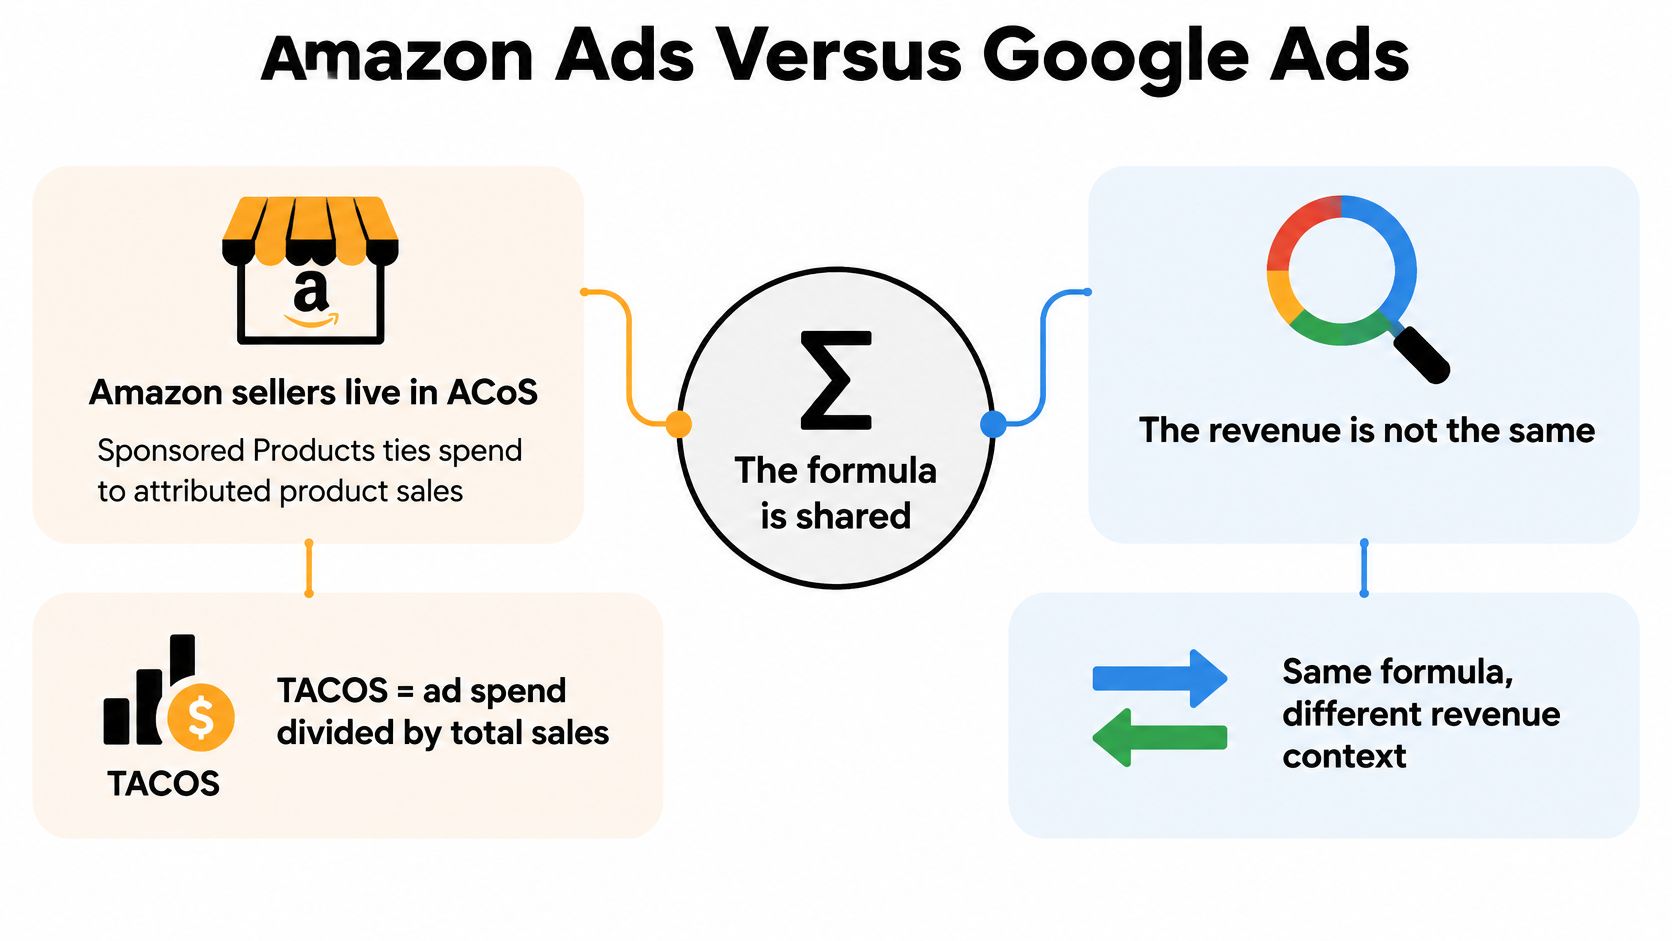
Amazon sellers may also track TACOS, total advertising cost of sales. That divides advertising spend by total sales, including organic sales, rather than only ad-attributed sales. It gives the operator a broader view of paid spend relative to the business, but it doesn't prove that advertising caused organic growth.
Attribution changes who receives credit
Google's data-driven attribution documentation explains that conversion credit is distributed using observed conversion paths rather than automatically giving the final interaction all the credit. Google's 2025 measurement guidance also emphasizes improving conversion imports and adding useful data when click identifiers such as GCLIDs are missing.
For the PPC lead, that creates a practical problem: the revenue column is partly a measurement decision. A keyword's reported return can change when the attribution model changes, even if the buyer's underlying journey doesn't.
Consider a shopper who first clicks a generic product query, compares options, and later returns through a branded search. The discovery term helped introduce the product. The branded term closed a buyer who already knew what to look for.
- Discovery traffic: A weaker direct return can coexist with useful assisted conversions.
- Branded traffic: An excellent reported return can include demand created by other ads, organic content, or existing customer relationships.
- Missing conversion data: Incomplete imports can make productive traffic look less valuable than it is.
The revenue column needs context
Don't assume a path report proves incrementality either. It tells you which recorded interactions preceded a conversion, not what would have happened without the ad. That distinction matters when you're deciding whether a campaign deserves more money.
For another explanation of the metrics, use this video alongside your account's own reporting.
Platform-reported ACoS and ROAS are platform-defined results that can be modeled, delayed, or incomplete. They aren't a complete account of customer acquisition.
A high-ACoS discovery term may introduce buyers who return through branded or organic searches. A low-ACoS term may mostly collect existing demand. The label alone won't distinguish them.
Why Category Benchmarks Mislead
Triple Whale reported 2025 median ecommerce ROAS of 2.87x across all verticals, 3.52x for Google Ads, and 1.86x for Meta Ads, as summarized in Rule1's ROAS benchmark article. The ACoS equivalents below are rounded conversions of those reported medians.
2025 median ROAS and the ACoS equivalent
| Slice | Median ROAS | Rough ACoS equivalent | Use it as |
|---|---|---|---|
| All ecommerce verticals | 2.87 | 35% | A sanity check, not a goal |
| Google Ads | 3.52 | 28% | Channel context only |
| Meta Ads | 1.86 | 54% | A reminder that social medians sit far from search |
None of these medians should become your target. They describe a group of advertisers, not your product economics, customer mix, or measurement setup.
Say a store has a 20% contribution margin. In that hypothetical case, its 5.0 break-even ROAS makes the Google Ads median unprofitable for its initial orders. A hypothetical store retaining 60% contribution before advertising could still leave contribution near the Meta median.
The benchmark graphic reinforces the warning, but the reporting table above contains the channel values to use for this comparison.
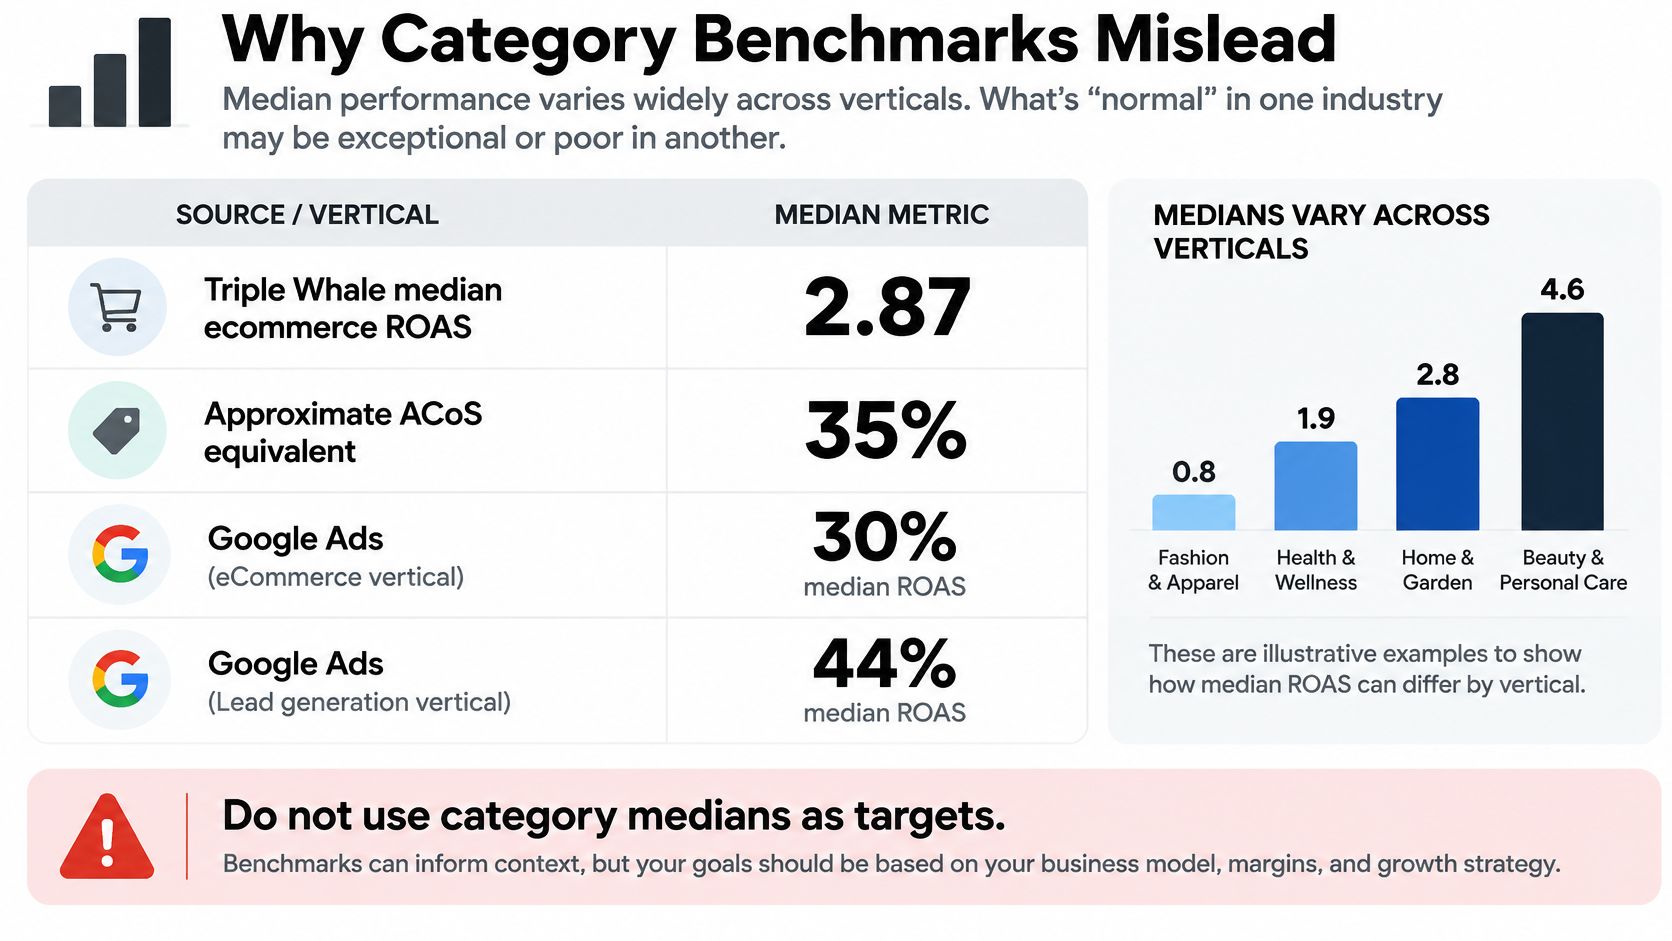
Investigate the mix before judging the result
A category label doesn't make accounts equivalent. A brand-heavy account and a prospecting-heavy account can sell similar products while buying very different kinds of traffic.
Before comparing an account with a median, inspect:
- Brand versus non-brand: Separate demand capture from searches made by buyers who haven't chosen a seller.
- New versus returning buyers: Don't treat repeat orders as evidence of new-customer acquisition.
- Attribution windows: Check how long each report allows an interaction to receive conversion credit.
- Returns and cancellations: Confirm whether the revenue reflects orders placed or revenue retained.
Use Google Ads industry benchmarks to identify questions worth investigating, not to set bids by category. An unusual result deserves a closer look. It doesn't automatically deserve a budget cut.
A median isn't an operating instruction
An agency should be able to explain why an account differs from its peers without apologizing for every gap. A business with expensive fulfillment needs a stricter efficiency target. A business deliberately funding customer discovery needs a separate acquisition case.
Benchmark discipline: Use the median to spot an outlier. Use the business's economics to decide what to do about it.
If the only argument for a target is that similar advertisers achieve it, the target isn't finished.
Which Metric Fits the Campaign
Match the metric to the job, not to habit. Keep the language familiar to the team operating the account, then set the allowed result according to the campaign's purpose and the products it sells.
A launch campaign and a mature product campaign shouldn't receive identical instructions just because both run on Amazon.
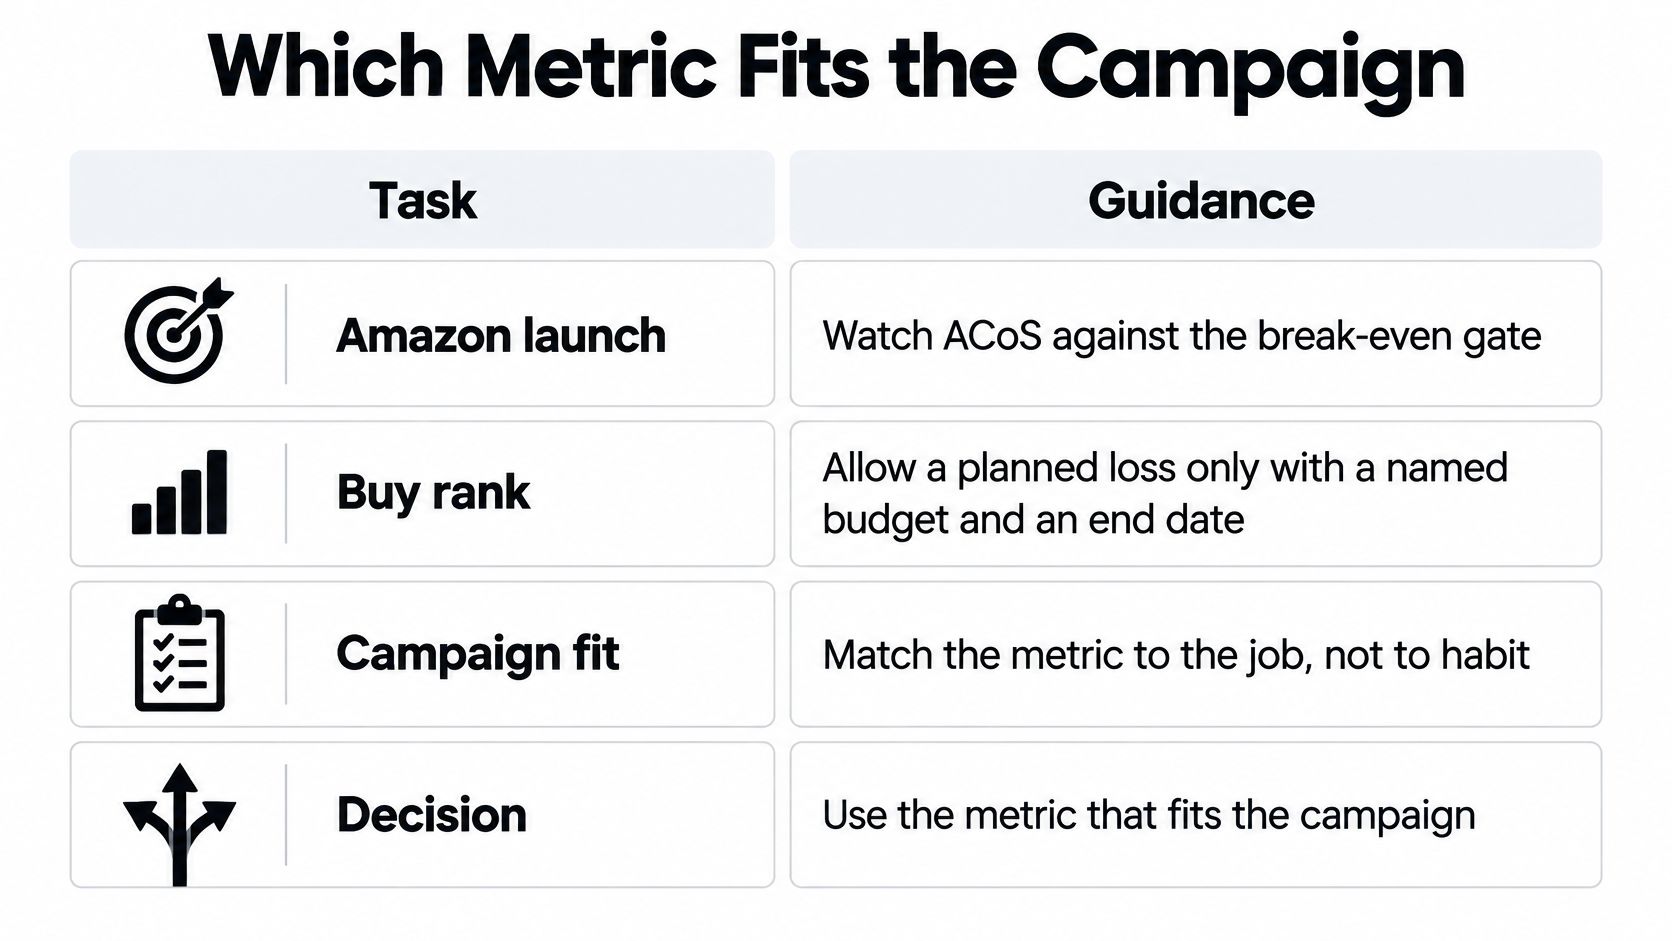
Amazon launch and mature products
For an Amazon launch, watch ACoS against the product's break-even boundary. If you deliberately accept a loss while pursuing visibility and sales history, give that experiment a named budget, an owner, and an end date. Buying rank is an objective, not a guaranteed outcome.
For a mature ASIN, tighten the operating target toward retained contribution. Review TACOS alongside sales so you can investigate whether increased paid spend is supporting growth or merely accompanying a shift away from organic orders.
Don't extend launch allowances indefinitely because the product still feels new. Once the planned test ends, require a fresh commercial decision.
Google search and prospecting
For Google non-brand search, use ROAS or conversion value divided by cost against the applicable margin threshold. Separate exact-match performance from broad-match exploration so strong high-intent queries don't conceal expensive discovery traffic.
For brand search, a huge ROAS isn't an automatic reason to add budget. Ask what additional customers or sales the extra spend would generate, rather than rewarding the campaign for collecting more credit.
For prospecting, accept a weaker initial return only when you can support the decision with new-customer revenue and credible repeat-purchase economics. Don't use hoped-for lifetime value to excuse an acquisition program you can't measure.
When you need a structured way to compare paid media returns across channels, NotFair provides a useful cross-platform resource. Keep the customer definition and revenue basis aligned before interpreting differences as budget opportunities.
Low-margin products need stricter targets
Consider hypothetical products with very different economics: a supplement retaining 35% contribution can leave a small contribution near 3.0 ROAS, while a cable retaining 15% needs roughly 6.7 ROAS to cover advertising. Those figures are calculated scenario thresholds, not supplement or electronics industry benchmarks.
The metric name stays the same. The acceptable number changes.
- High contribution: You have more room to fund acquisition, though you still need evidence that added spend produces useful sales.
- Thin contribution: You need stricter bids, tighter query relevance, or better order economics.
- Mixed catalogue: Split targets by economic similarity instead of applying the flagship product's allowance everywhere.
Choose a metric your team can operate consistently. Write the commercial objective beside it.
Keep or Cut Terms After the Gate
Start with the break-even ACoS or ROAS written into the campaign brief, plus the profit contribution you intend to retain. Then review search terms against that operating target. Don't replace it with a category median because the account has had a difficult week.
The sequence matters. A term can look wasteful before its conversions arrive, and another can look brilliant while adding little incremental demand.
Run the checks in order
Wait for the campaign's conversion lag.
Use the account's observed time from click to conversion, not a deadline chosen because you check performance every morning. A research query judged on day three may still have buyers comparing products. Exclude immature click cohorts from the decision, or mark them clearly as incomplete.Read the paths, not just the final column.
Inspect attribution and conversion-path reports for evidence that the term regularly starts or assists purchases. Check whether a later branded interaction receives most of the reported value. Assistance earns investigation, not permanent protection from scrutiny.Separate new-customer value from repeat demand.
Where your measurement supports it, distinguish first-time buyers from returning customers and branded traffic. Don't credit a discovery campaign with customer acquisition merely because it generated an order. Also check whether the acquired buyers return profitably rather than relying on a projected lifetime-value figure.Apply the correct product-margin gate.
Match the term's sales to the products purchased. If the query sells a mix of products, use the contribution associated with that mix rather than a convenient account average. A term that clears the target on gross revenue may fail after refunds or discounted orders are recognized.Keep discovery terms with a supported acquisition case.
Retain a high-ACoS discovery term when mature customer cohorts and path evidence show that it introduces buyers whose subsequent contribution justifies the spend. Document the reason and the conditions for keeping it. Otherwise, discovery becomes a label attached to any expensive keyword.Cut terms that consume budget without useful demand.
Negate irrelevant queries and repeated spenders without orders once the conversion window is mature. A low-ACoS term can also deserve a reduction if a controlled test shows it mostly captures demand you already own and crowds out more valuable queries. Don't cut brand coverage solely because it's branded; establish what you lose without it.Recheck after a full attribution window.
Record the change date, match type, affected campaign, and expected outcome. Review the mature results before making another major adjustment. If you change bids, negatives, landing pages, and budgets together, you'll struggle to identify which action helped.
Resolve conflicting evidence with a test
Two common failures sit at opposite ends of the report. One advertiser pauses a research term before buyers finish their journeys. Another scales a brand term because its ROAS looks heroic, without checking whether the additional spend changes total sales.
When attribution paths suggest value but the profit calculation doesn't, run an incrementality test. Use a controlled holdout where feasible, define the business outcome in advance, and keep unrelated changes limited. Compare total contribution and new-customer outcomes, not just the conversions still credited to the campaign that remains active.
A path report describes recorded behavior. A controlled test helps you assess what changes when you remove or reduce advertising.
Turn the review into a short action list
This week, sort the Amazon search terms report and the Google Ads search terms report by spend. Build a review list of five terms above your ACoS ceiling and five below it, or the corresponding failing and passing groups if you use ROAS. This is a manageable review batch, not a statistical sample.
For the Amazon account, use a deliberate negative keyword process rather than excluding every query that has an unattractive recent result. For Google Ads, promote proven, relevant queries into exact or phrase match where that gives you clearer control; check routing and existing coverage before duplicating them.
In Keywordme, we let you remove junk keywords from the search terms report with a single click or a quick mouse highlight. You can build negative or positive keyword lists with a single click or a drag of the mouse, then download fully formatted lists in seconds.
Finish that review batch before changing the budget. Keep terms that pass the economics and acquisition checks, negate confirmed waste, and promote useful queries that were hidden inside broader targeting.
Keywordme helps you turn search-term decisions into negative and positive keyword lists without manual formatting and copy-and-paste work. Visit Keywordme to clean up wasted Google Ads spend and give the queries that earn their budget clearer control.
