Google Ads Industry Benchmarks to Boost Your Success
Google Ads Industry Benchmarks to Boost Your Success

Ever find yourself staring at your Google Ads dashboard, wondering if your numbers are actually any good? It's a common feeling. Knowing the average benchmarks for your industry is the first step toward answering that question. It gives you a baseline for key metrics like Click-Through Rate (CTR), Cost-Per-Click (CPC), and Conversion Rate (CVR), so you can see if you're ahead of the curve or have some ground to make up.
This isn't just about satisfying curiosity; it's about making smarter decisions. Let's break down what these numbers mean and why they're so important.
Your Quick Guide to Google Ads Performance Metrics
Before we get into the nitty-gritty of industry-specific data, let's make sure we're all on the same page about the core metrics. Think of these as the vital signs of your campaign's health. Without a clear understanding of what they measure, the data is just a bunch of meaningless numbers.
To get a complete picture, it’s helpful to understand the full suite of key advertising metrics like CTR, CVR, LTV, and AOV. These benchmarks provide crucial context, telling you whether your performance is standard for your field or if something needs a closer look.
Below is a table summarizing the average Google Ads metrics across all industries. Use this as a quick reference to see how the different pieces fit together before we explore the nuances of each sector.
Average Google Ads Metrics Across All Industries
This table gives you the "big picture" averages. But remember, "average" can be misleading. As you'll see, performance varies wildly from one industry to the next, which is why drilling down into your specific sector is so critical for meaningful insights.
Why Benchmarks Matter
So, why should you even care about these industry averages? Because they provide a much-needed reality check.
- Set Realistic Goals: Instead of pulling numbers out of thin air, you can set targets that are both ambitious and achievable for your specific market.
- Identify Weak Spots: Is your CTR way below your industry's average? That's a huge red flag, pointing to potential issues with your ad copy, creative, or targeting.
- Justify Performance: Benchmarks give you objective data to show clients or your boss how your campaigns are really doing compared to the competition.
The latest data really drives this point home. The average Google Ads click-through rate (CTR) across all industries is 6.66%. But that number doesn't tell the whole story. The Arts & Entertainment industry, for example, enjoys a massive 13.10% CTR, while Attorneys & Legal Services sits at a much lower 5.97%. This shows that some industries are just naturally "clickier" than others.
Of course, clicks are great, but conversions are what really matter. Tying your ad spend to actual business outcomes is the whole point. For a step-by-step guide on getting this set up properly, check out our article on setting up Google Ads conversion tracking. It’s the only way to truly measure your return on investment.
Google Ads Benchmarks By Industry
Alright, let's get down to what really matters: your industry. The big-picture averages are a decent starting point, but they don't tell the whole story. A "good" Click-Through Rate for a law firm is worlds apart from what an e-commerce store should aim for. The only way to get a real feel for your performance is to compare your numbers against the right google ads industry benchmarks.
Think of this data as your competitive landscape map. It helps you understand the unique challenges and opportunities in your specific market. For example, some sectors, like legal services, are incredibly competitive, and that high demand for valuable keywords naturally pushes costs way up. Then you have industries like dating and personals, which can tap into powerful emotional triggers, resulting in much higher click and conversion rates.
This snapshot gives you a quick look at the average benchmarks for CTR, CPC, and conversion rate across all industries on the Google Search Network.
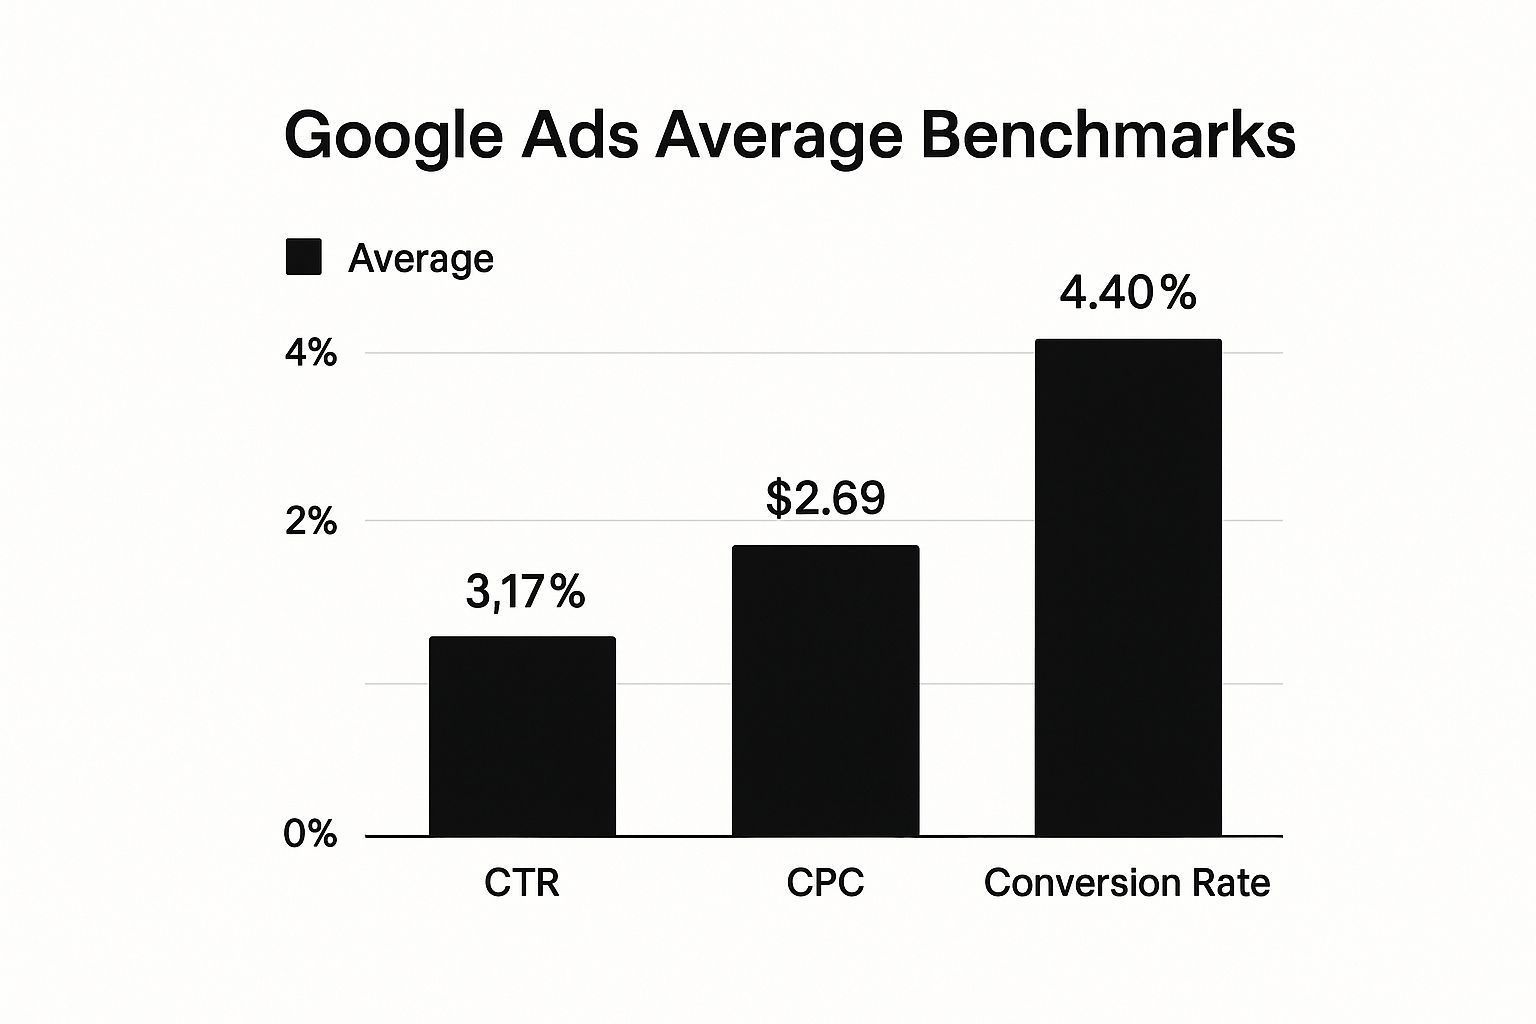
These overall numbers—an average CTR of 3.17%, an average CPC of $2.69, and an average conversion rate of 4.40%—are a solid baseline. But the truly useful insights come when we break things down by industry.
Performance Metrics for Key Industries
Ready to see how you measure up? We've put together a handy table breaking down the average CTR, CPC, and Conversion Rate (CVR) across 16 major industries. Use this as your go-to reference to find your sector and see where your campaigns stand.
Keep in mind, these are median figures. We use medians because they give you a much more realistic picture by preventing a few monster advertisers from completely skewing the averages. This data is your first step toward smarter campaign analysis. For instance, if you run an e-commerce store and your CPC is way above the $1.16 average, that’s a clear signal to start digging into your keyword targeting or work on improving your Quality Score.
Google Ads Performance Benchmarks Across Key Industries
Here’s a detailed breakdown of performance benchmarks for Google Search ads across some of the most common industries.
This table makes it easy to spot the outliers and understand the specific dynamics you're up against in your own campaigns.
How To Interpret The Industry Data
A quick glance at the numbers reveals some interesting stories. The Legal and Consumer Services industries are grappling with the highest average Cost-Per-Click, with Legal hitting a staggering $6.75 per click. This isn't surprising when you consider the cutthroat competition and the massive lifetime value of a single new client.
On the flip side, the Dating & Personals sector is absolutely crushing it. It boasts the highest average CTR at 6.05% and an incredible average Conversion Rate of 9.64%. This is a great example of what happens when you have a highly motivated audience and ads that connect on a deeply emotional level.
The big takeaway here? Don't just compare your campaigns to the overall average. Your industry's unique context—from the searcher's intent to the level of competition—is the only benchmark that really matters.
Industries with the lowest CTRs, like Technology (2.09%) and B2B (2.41%), typically involve more complex products and much longer sales cycles. Someone searching for enterprise-level software isn't going to click as impulsively as someone looking for a date tonight. That distinction is everything when setting realistic goals. A 2% CTR for your tech company might actually be pretty solid, but a 2% CTR in the travel industry would be a major red flag that something’s broken.
Alright, so you've got the benchmark data in hand. You’ve pinpointed where your industry stands on the charts. Now what? It's one thing to know the average CTR or CPC, but the real magic happens when you figure out what your own numbers are trying to tell you. Think of these Google Ads industry benchmarks as a compass, not a report card.
The goal isn't just to see if your numbers are "good" or "bad." It's about looking deeper. Your campaign data is telling a story, and these benchmarks are the key to translating it. They help you ask smarter questions and turn a spreadsheet of metrics into real, actionable steps for your Google Ads account. Let's break down how to do that.

Putting Your Campaign Data in Context
First thing's first: your metrics never tell the whole story on their own. A number that looks a bit underwhelming on the surface might actually be a sign of a killer strategy. You have to look at how your metrics play together to get the full picture.
Here’s a classic scenario I see all the time: your Click-Through Rate (CTR) is trailing the industry benchmark, but your Conversion Rate (CVR) is through the roof.
This usually means your ads are doing an incredible job of speaking only to the right people. They might not be flashy enough to get every single person to click, but they're attracting highly qualified leads who are ready to buy. Your ad copy and targeting are effectively weeding out the tire-kickers.
In this situation, you’re looking at a quality-over-quantity win. Instead of chasing more clicks by changing your ads, you should probably double down on optimizing your landing page to convert even more of that amazing, high-intent traffic.
Spotting Common Performance Problems
Benchmarks are also your early warning system. They're perfect for flagging issues that could be quietly draining your budget. When your numbers are way off from the industry standard, it's time to put on your detective hat. Take a consistently high Cost-Per-Click (CPC), for instance.
If you notice your CPC is stubbornly higher than your industry's average, a few culprits could be to blame:
- Tough Keyword Competition: You could be bidding on keywords that are extremely valuable and, therefore, extremely competitive. This happens a lot in industries like legal services, where a single new client is worth a very high acquisition cost.
- A Low Quality Score: This is a big one. If Google thinks your ads and landing pages aren't as relevant as your competitors', it'll make you pay more for placement. A low Quality Score almost always points to a disconnect between your keywords, ad copy, and landing page.
- A Wonky Bidding Strategy: Your current bid strategy might just be the wrong tool for the job. If it isn't aligned with your actual campaign goals, you could easily end up overpaying for clicks that have little chance of converting.
Knowing these potential causes helps you go from "Wow, my CPC is high" to "I need to check my Quality Score and keyword competition." By regularly comparing your performance against Google Ads industry benchmarks, you can catch these problems early, make smart adjustments, and get your campaigns humming along for a much better ROI.
Why Your Campaign Numbers Might Differ from Benchmarks
So, you’ve pulled up the google ads industry benchmarks, put them next to your own campaign data, and… they don’t match. Don’t panic. This is completely normal, and honestly, it would be weird if your numbers were a perfect match.
Think of benchmarks as a broad average across thousands of wildly different advertisers. We're talking about massive corporations with eye-watering budgets lumped in with tiny local shops just getting their feet wet. Your business is unique, so it’s only natural your performance will be, too. Let's break down exactly why your results will—and probably should—look different.

Factors That Skew Your Results
A ton of different variables can pull your metrics above or below the industry standard. Getting a handle on these is key to setting goals that actually make sense and reading your data the right way. Instead of feeling down about it, use these differences to get a clearer picture of what makes your strategy work.
The goal isn't to perfectly match the benchmark. It's to understand why you're different and then use that knowledge to build a smarter, more profitable campaign for your specific business context.
Here are a few of the biggest reasons your numbers won't line up perfectly:
- Your Budget Size: A small, laser-focused budget is going to perform differently than a huge one aimed at blanketing an entire region with brand ads. Smaller budgets often have to be way more efficient, which might mean a higher CPA but also much better-qualified leads.
- Brand Recognition: Is your company a household name, or are you the new kid on the block? Big, well-known brands naturally get higher CTRs because people already trust them. If you’re building your reputation from the ground up, your metrics will reflect that, and that’s perfectly fine.
- Geographic Targeting: Running ads in a competitive market like New York City will almost always come with higher CPCs than targeting a small rural town. Where you advertise directly shapes the level of competition you face and how much you'll pay for clicks.
Seasonality and Your Specific Offer
Beyond the usual suspects like budget and brand, two other massive factors are always at play: the time of year and what you're actually selling. These can create huge swings in performance that broad benchmarks just can’t account for.
Seasonality is a game-changer for so many industries. A pool company is going to crush it in the spring and early summer, while a tax accountant sees their boom from January to April. Comparing your slow season stats to an annual benchmark is like comparing apples to oranges—it just doesn't give you the full story.
And then there's your specific offer, which might just be the most important piece of the puzzle. Are you pushing a free demo or a high-ticket item? The commitment you're asking for drastically changes your conversion rates. A "Start Free Trial" offer will always convert better than a "Buy Now" button on a $2,000 product, even if they're in the exact same industry.
Ways to Actually Improve Your Ad Performance
Knowing your numbers is one thing, but acting on them is where the real growth happens. Seeing how you stack up against Google Ads industry benchmarks is just the diagnosis; now it’s time for the treatment.
Whether your goal is to pump up a sad click-through rate, slash a sky-high cost-per-click, or just get more conversions, making the right tweaks can change everything. Think of this as your playbook for turning those benchmark insights into actual results. Let's dive into some proven strategies you can put to work right away.
Nail Your Ad Copy and Creative
Your ad is your first handshake with a potential customer. If it doesn't connect, you've lost the click before you even had a chance to earn it. The name of the game is being hyper-relevant to what the searcher is looking for.
- Get Specific: If benchmarks show your CTR is in the gutter, generic copy is probably the culprit. Instead of "Legal Services," try something like "Car Accident Lawyer in Austin." Specificity doesn't just get more clicks—it gets the right clicks.
- Use a Strong Call-to-Action (CTA): Don't be shy. Tell people exactly what you want them to do. Swap out passive phrases for action-packed ones like "Get Your Free Quote" or "Schedule a Consultation Today."
- Test Everything, All the Time: A/B testing different headlines and descriptions should be a constant habit. Seriously, even tiny changes can lead to huge wins. Pit emotional appeals against logical ones and see what your audience actually responds to.
And don't forget the visuals. While keywords and bids are critical, great-looking ads can make a massive difference in how people engage. Investing in things like high-quality product photography for ad agencies can really help your ads pop and boost those conversion rates.
Sharpen Your Keyword Strategy
Think of your keywords as the foundation of your search campaigns. If that foundation is shaky, the whole thing will eventually crumble. This isn't just about picking the right keywords; it's about aggressively blocking the wrong ones.
A messy keyword list is often why your CPC is so high—you're basically paying for clicks from people who were never going to buy from you anyway. This is where a solid negative keyword list becomes your best friend for trimming wasted ad spend.
A well-managed negative keyword list is one of the fastest routes to profitability. You're telling Google what searches not to show your ads for, making sure every dollar goes toward relevant, high-intent traffic.
This is what stops your ads for "high-end running shoes" from showing up when someone searches for "free shoe repair." If you want to master this, you should check out our guide on building a powerful Google Ads negative keywords list.
Fix Your Landing Page Experience
You could write the world's greatest ad, but if it sends people to a clunky, confusing, or slow landing page, your conversion rate is toast. The user's journey doesn't end with the click; it ends with the conversion.
Your landing page has to follow through on the promise your ad made. If your ad mentions a 20% discount, that discount better be the first thing people see on the page. A smooth, consistent experience from ad to landing page is a huge factor in your Quality Score, which directly helps lower your CPC.
- Match the Message: The headline on your landing page should feel like a direct continuation of your ad copy.
- Make it Fast: A slow page will kill your conversions before they even have a chance. Use a tool like Google's PageSpeed Insights to see where you stand.
- Keep Forms Simple: Only ask for the absolute bare minimum information you need. The fewer fields someone has to fill out, the more likely they are to actually do it.
Using Benchmarks to Build a Smarter Ad Strategy
The smartest advertisers I know don't just use Google Ads industry benchmarks to see how they did last quarter. They use them to build a forward-thinking strategy that’s both predictable and proactive. When you weave this data into your campaign planning, you stop reacting to the market and start anticipating it. That's the real game-changer—it’s the difference between guessing and genuine strategizing.

This approach turns raw numbers into a powerful tool for growth. By applying benchmarks the right way, you can draw a clear roadmap for your campaigns, set realistic expectations, and stay one step ahead of your competition. As you build out your strategy, it's also smart to think about how Google Ads fits in with other proven lead generation solutions to drive business growth.
Forecast Budgets with Confidence
Let's get practical. One of the best ways to use this data is for budget forecasting. When you’re thinking about spinning up a new campaign or breaking into a different market, CPC benchmarks are your best friend. They give you a solid, realistic starting point for what your ad spend might look like.
Say you’re in the B2B world and the data shows an average CPC around $3.33. Suddenly, you can build a budget model that isn't just a shot in the dark. You can actually calculate how many clicks your budget will buy and project potential lead costs, making your financial planning much more solid.
This takes your budget from a giant question mark to a calculated investment. It gives you the confidence to pitch new campaigns to your boss or client with data-backed projections they can actually get behind. This forecasting ability is crucial for scaling your efforts without burning through cash.
Set Realistic Performance Goals
Benchmarks are also absolutely essential for setting goals that your team can actually hit. Instead of pulling a conversion rate goal out of thin air, you can use industry-specific CVR and CTR data to establish KPIs that make sense for your specific market.
This helps you align everyone's expectations with reality. For a more detailed look at turning these goals into action, our guide on PPC campaign optimization walks through the steps to systematically boost your performance.
- Aligning Expectations: If you’re in an industry with a notoriously low CVR, like e-commerce (2.81%), you can set the right tone. You can explain to stakeholders that success won't look the same as it does in a high-CVR field like Dating & Personals (9.64%).
- Motivating Your Team: Nothing kills morale like impossible goals. When you set clear, attainable targets based on real-world data, your team stays focused and motivated. They know what they're aiming for and can celebrate legitimate wins.
Anticipate Market Shifts Proactively
Finally, don't just look at a benchmark report once and file it away. The real strategic gold comes from tracking these trends over time. Are CPCs in your industry slowly ticking upward? Are competitors' click-through rates getting better?
Keeping an eye on these shifts helps you see changes in the competitive landscape before they hammer your bottom line. It lets you adapt your strategy proactively—maybe by refreshing your ad copy, tweaking your bid strategy, or finding new keyword opportunities—instead of scrambling to react after your performance has already tanked.
A Few More Questions About Google Ads Benchmarks?
It’s completely normal to have more questions after digging into a pile of data. Let's be honest, benchmarks can raise as many questions as they answer. So, I’ve put together some quick answers to the most common things people ask when they start looking at these industry stats.
Think of this as the "what now?" section. Getting these details straight will help you use the data with more confidence and build a much smarter advertising strategy.
How Often Do These Benchmarks Actually Get Updated?
Google Ads benchmarks are anything but static. They're always moving, influenced by everything from big market shifts and shopper habits to seasonal rushes and how many competitors are bidding against you. Most of the big, comprehensive reports covering google ads industry benchmarks come out once a year. But for your own sanity and success, you should be checking in on your own performance monthly, if not quarterly.
This regular pulse-check lets you catch new trends and pounce on them fast. A yearly report is great for setting your overall direction, but your own monthly numbers tell you what’s happening on the ground right now.
The best advertisers I know use annual benchmarks to set their North Star for the year. Then, they use their own monthly data to make small, tactical tweaks along the way. This double-layered approach means you're never just guessing.
Do These Numbers Work for Both Search and Display Ads?
That's a fantastic and critical question. The benchmarks we've been talking about in this guide are almost exclusively for Google Search ads. This is a huge distinction because what a user is doing on the Search Network is completely different from their mindset on the Display Network.
When someone is on Google Search, they're actively hunting for something. That active intent changes everything.
- Search Ads: People are typing in keywords because they have a specific need or question. This almost always leads to higher Click-Through Rates (CTR) and Conversion Rates (CVR).
- Display Ads: These are more like digital billboards. They show up on websites while people are just browsing, reading articles, or watching videos. The goal here is usually about getting your name out there (brand awareness), so the CTRs are naturally way lower, and costs can be all over the map.
Always, always compare apples to apples. If you’re running Display campaigns, you’ll need to find benchmarks specific to the Display Network to get a real sense of how you’re doing.
My Industry Isn't on the List. What Now?
Yeah, this happens all the time, especially if you're in a super-specific niche. If your industry didn't make the list, don't sweat it. You've still got a couple of solid ways to figure out where you stand.
First, find the next-best-thing. Pick the industry that’s the closest cousin to yours and use its benchmarks as a rough guide. For example, if you sell artisanal, custom-engraved dog collars, you could look at the benchmarks for "E-Commerce," "Pets & Animals," or maybe even "Home Goods" to get a directional feel.
The second—and frankly, more important—step is to become your own benchmark. Start tracking your own CTR, CPC, and CVR month after month. Before you know it, your own historical data will become the most valuable and accurate benchmark you have. It lets you measure your progress against your own past performance, which is the truest way to define what "good" actually looks like for your business.
Ready to stop guessing and start optimizing your campaigns like a seasoned pro? keywordme is an all-in-one Google Ads tool built to help you slash junk keywords, uncover terms that actually convert, and speed up your entire optimization process. Give it a shot for seven days and see what you've been missing. Start your free trial at keywordme.io.