
What Is a Good ROAS for Google Ads? Benchmarks Explained
What Is a Good ROAS for Google Ads? Benchmarks Explained


You can be losing money at 4x ROAS. That's the part most benchmark lists skip. Google's economic impact FAQ uses a conservative 2.0x figure from chief economist Hal Varian's estimate that advertisers receive approximately 2 to 2.3 times their total Google Ads expenditure in economic value. That's a historical reference point, not a profit line. Whether your number is good depends on what you keep from each sale before ads, how you value a conversion, and what job the campaign is doing. If you're asking what is a good ROAS for Google Ads, start there, not with somebody else's average.
What a Good ROAS Looks Like at a Glance
There's no single good ROAS. A return that works for a high-margin subscription business can lose money for a low-margin retailer. Repeat purchases matter, too: an initial order may leave little after ad costs but still be worthwhile if customers reliably buy again. Branded search can show a high return while bringing in little revenue that the business would not have earned anyway.
Benchmarks offer context, not a target. Google's broad historical marker is about 2.0x to 2.3x in economic value, with Google using the conservative end publicly. That figure does not account for your product costs, shipping, returns, payment fees, salaries, or software. Your account's reported ROAS is a figure to check against actual business results, not proof of profit.
Advertiser benchmarks show a different reference point. BenchMarketing's Google Ads ROAS benchmarks reported a 2.9x median across benchmarks covering Q1 2023 through Q4 2024. Advertisers at 4.2x or higher were in the top quarter. A 3.1x return is slightly above that dataset's median, but it does not establish whether you are profitable.
Reference ROAS Points for Google Ads
| Reference point | ROAS | What it tells you |
|---|---|---|
| Google's historical economic-value estimate | About 2.0x to 2.3x | Broad historical marker, not a profit threshold |
| Median Google Ads ROAS, Q1 2023 to Q4 2024 | 2.9x | Typical advertiser in the BenchMarketing dataset |
| Top-quarter advertisers, same period | 4.2x or higher | The level that places an advertiser in the top quarter |
Use these figures to frame questions, not to set your bid target. Differences in order value, repeat purchases, lead close rates, and tracking can make two advertisers' ROAS difficult to compare. For the calculation behind the ratio, see a practical guide for ecommerce advertisers.
Practical rule: Benchmarks help you ask better questions. Your margin sets the target.
A ROAS below these reference points can still work if sales contribute enough after ad costs and repeat purchases are supported by real business results. A return above the top quarter can still leave you short on cash if costs absorb the revenue. The useful comparison is between reported ROAS and what the business keeps.
Work Out Your Break-Even ROAS From Margin
Start with one sale and ignore the account for a minute. Say a product sells for $60. After cost of goods and shipping, you're left with $33. That's your contribution before ad costs, and $33 divided by $60 gives you a 55% contribution margin.
Now flip it. Break-even ROAS equals 1 divided by your contribution margin before ad costs. For that product, 1 divided by 0.55 is about 1.8x. At 1.8x, ad spend takes roughly the whole $33, so the sale pays for itself and its ads and leaves nothing extra. Above that, the sale contributes something. Below it, you're buying revenue at a loss.
Finding your own margin isn't complicated, but people skip costs. Take revenue, subtract cost of goods, shipping and fulfillment, then divide the result by revenue. Include the variable costs that move with each order, such as packing, payment processing and expected returns if they hit you regularly. The cleaner that margin, the more honest your target.
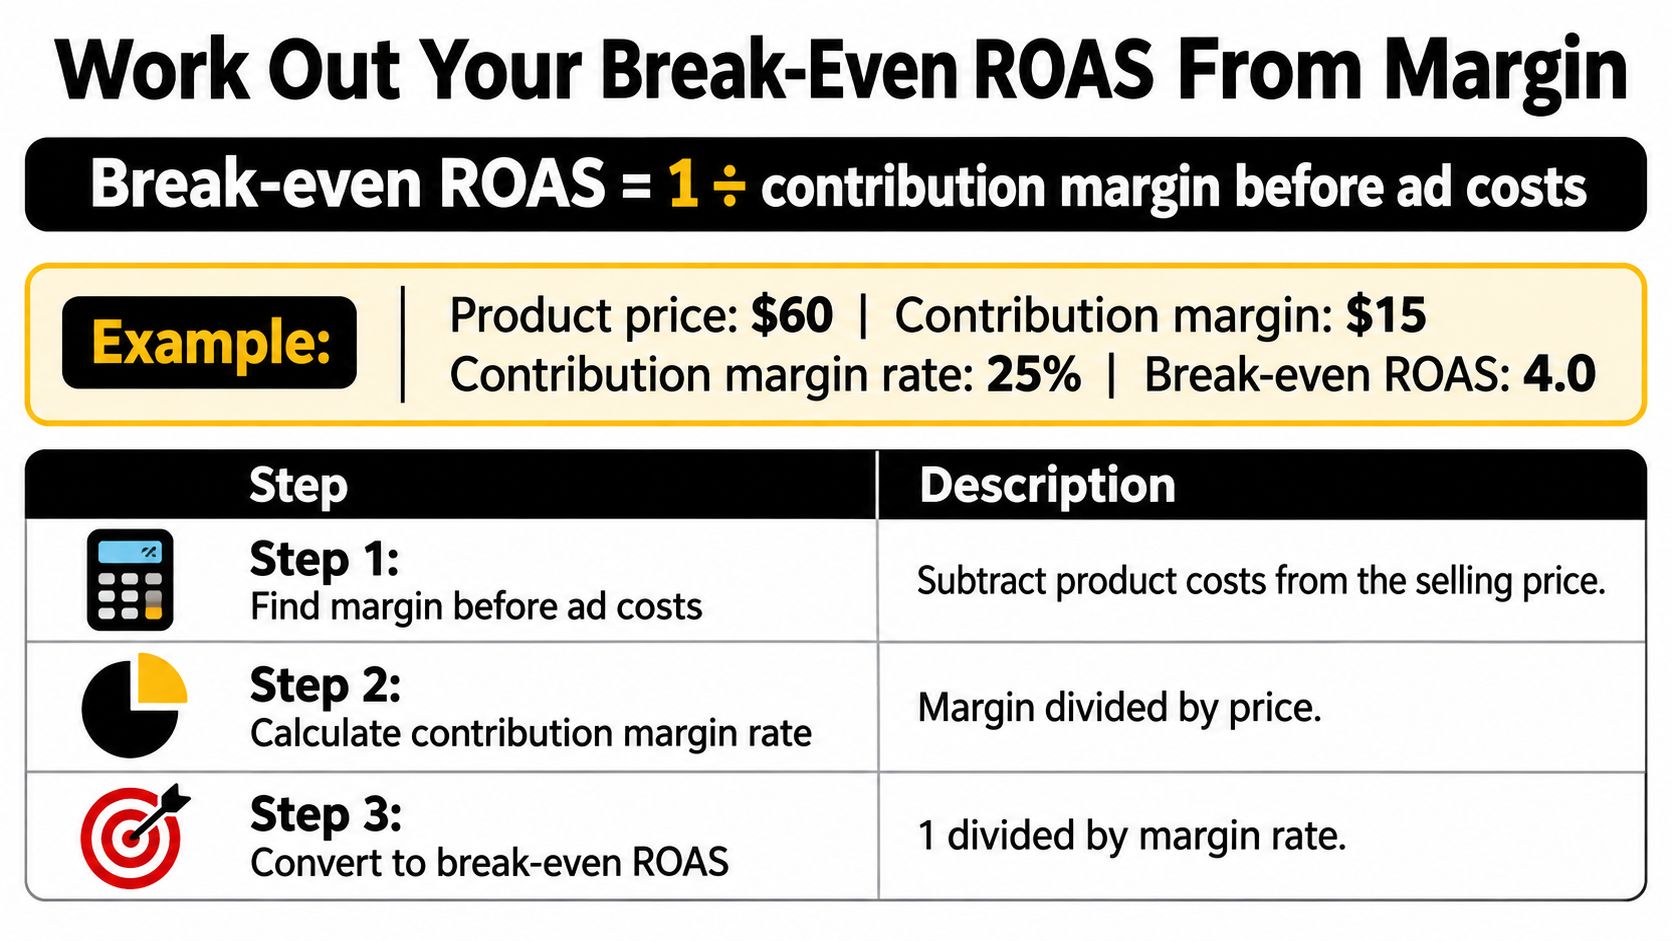
The formula gets unforgiving as margin shrinks. Google Ads defines ROAS as total conversion value divided by ad cost, and at a 25% contribution margin you need 4x just to cover advertising expense, while a 60% margin breaks even at about 1.67x. That's why a 4x ROAS can still lose money. For the thin margin seller it's merely the starting line, and fixed costs haven't been paid yet.
Break-Even ROAS by Contribution Margin
| Contribution margin before ads | Break-even ROAS |
|---|---|
| 20% | 5.0x |
| 25% | 4.0x |
| 30% | 3.33x |
| 40% | 2.5x |
| 50% | 2.0x |
| 60% | 1.67x |
I'd run your own numbers through Arlo's guide to breakeven ROAS if you want a quick calculator view before you touch campaign settings. It won't decide your strategy, but it'll stop you anchoring on a round number somebody quoted in a forum.
Remember what break-even leaves out. Salaries, software, rent and agency fees don't disappear because an order covered its ads. Your real floor sits above break-even once those fixed costs and a profit goal enter the picture. The gap you add is a business decision, not a Google Ads setting.
Subscription and repeat purchase businesses get one legitimate exception. You can accept a lower first order ROAS when customer lifetime value is substantially higher than first order revenue. Only do that with measured retention and payback, though. An assumed lifetime value turns a loss making campaign into a story you tell yourself. Calculate break-even first, then set a target above it.
Benchmarks by Industry and Business Model
Industry averages offer context, not a target. A summary of WordStream's analysis of more than 17,000 U.S.-based Google Ads campaigns reports an average CPC of $4.66 and an average conversion rate of 6.96% across industries. At those figures, it takes about 14.4 clicks to get a conversion, costing roughly $66.95 in ad spend.
Google Ads Benchmarks by Industry, 2024
| Industry | Average CPC | Average conversion rate |
|---|---|---|
| All industries | $4.66 | 6.96% |
| Attorneys and legal services | $8.94 | 11.08% |
| Home and home improvement | $6.96 | 11.08% |
| Dentists and dental services | $6.82 | 11.08% |
| Automotive repair, service and parts | $6.82 | 12.96% |
| Animals and pets | $6.82 | 12.03% |
The same traffic can produce very different ROAS because conversion value matters more than CPC or conversion rate alone. If a conversion costs $66.95, a $500 sale produces about 7.47x ROAS; a $100 sale produces about 1.49x. Use your own margin and order values to judge whether either result works for your business. A Google Ads industry benchmarks breakdown provides further context for comparing sectors, but an industry average cannot tell you whether your campaign is profitable.
Business model changes what the reported conversion value means:
- Lead generation: A conversion may represent estimated pipeline value rather than collected revenue. Compare reported value with closed revenue and lead quality.
- Ecommerce: Average order value affects ROAS directly. Bundles and add-ons can increase order value without changing bids, though the extra revenue still needs to support your margins.
- Subscriptions: First-order ROAS may understate value if customers renew. Use measured lifetime value and payback period rather than assumed future revenue.
These figures are a snapshot, not a target to copy. Auction costs, offers and tracking differ across accounts, so use benchmarks to spot questions worth investigating. Your own results, judged against your margin, are a more useful guide than another advertiser's average.
Check Eligibility and Measurement Before You Trust It
Before you argue about whether your ROAS is good, check whether Target ROAS should even be running. Google's value based bidding eligibility requirements say Search should have at least 15 conversions during the previous 30 days at the conversion tracking level, Shopping needs at least 15 conversions per Merchant Center ID in the last 30 days, and Demand Gen needs either 50 value bearing conversions in the last 35 days including at least 10 in the last seven days, or 100 value bearing conversions across Demand Gen campaigns in the account. Only conversions with a value greater than zero count toward the relevant requirement.
Those thresholds aren't bureaucratic hurdles, they're a signal quality test. With too little valued conversion data, the bidding system is guessing from a handful of outcomes. One big order can yank the reported ROAS around for days. Thin volume makes both good weeks and bad weeks look more meaningful than they are.
A Short Measurement Checklist
- Consistent values: Is conversion value tracked the same way across the campaigns you're comparing, with real revenue rather than placeholder numbers?
- Clean imports: Have you removed duplicate or imported conversions that count the same sale or lead twice?
- Enough volume: Do you clear the eligibility thresholds above with genuine value bearing conversions?
- Honest lead values: If you generate leads, does the value reflect closed deals, or did someone assign a hopeful number to every form fill?
If any of those answers wobble, fix tracking before touching targets. Our Google Ads conversion tracking guide walks through the setup checks that keep the value signal clean.
Even clean tracking has limits you should respect. Platform ROAS shows that a conversion followed an ad interaction inside your attribution rules, and it does not prove the ad caused the sale. Privacy changes, cross device behavior and modeled conversions all widen the gap between reported and real. Overlapping channels claim the same customer too, each with a straight face.
A high ROAS is a claim to verify, not a fact to frame. Brand and remarketing campaigns can look brilliant while mostly collecting demand that already existed.
Where you can, test incrementally. Compare new customer share between exposed and unexposed groups, or run a geo or time based holdout and watch total revenue rather than platform credit. If conversions fall short of eligibility in the meantime, don't force value based bidding. Use a simpler bidding approach, build clean conversion volume first, and switch once the data can carry the decision.
Set Your Target ROAS From History
The formula itself is simple. Target ROAS equals conversion value divided by ad cost, times 100 to express it as a percentage. So $3 of value for every $1 spent becomes 300%. The percentage format trips people up, because 300% sounds enormous while 3x sounds modest, but they're the same number wearing different clothes.
Google's Target ROAS guidance defines Target ROAS as the average conversion value an advertiser wants to receive for each dollar spent, and its example sets 500% when the goal is $5 in sales for every $1 of ad spend. That's five times the ad cost in tracked conversion value, not a five hundred fold return. Keep that conversion straight before anyone on your team celebrates or panics.
Now, where should your percentage sit? Start from the break-even figure from your margin math, then add a buffer for overhead and the profit you want to keep. That gives you a floor. A target below the floor needs a deliberate reason, such as proven repeat value, and a target far above it needs evidence your account can deliver it without strangling volume.
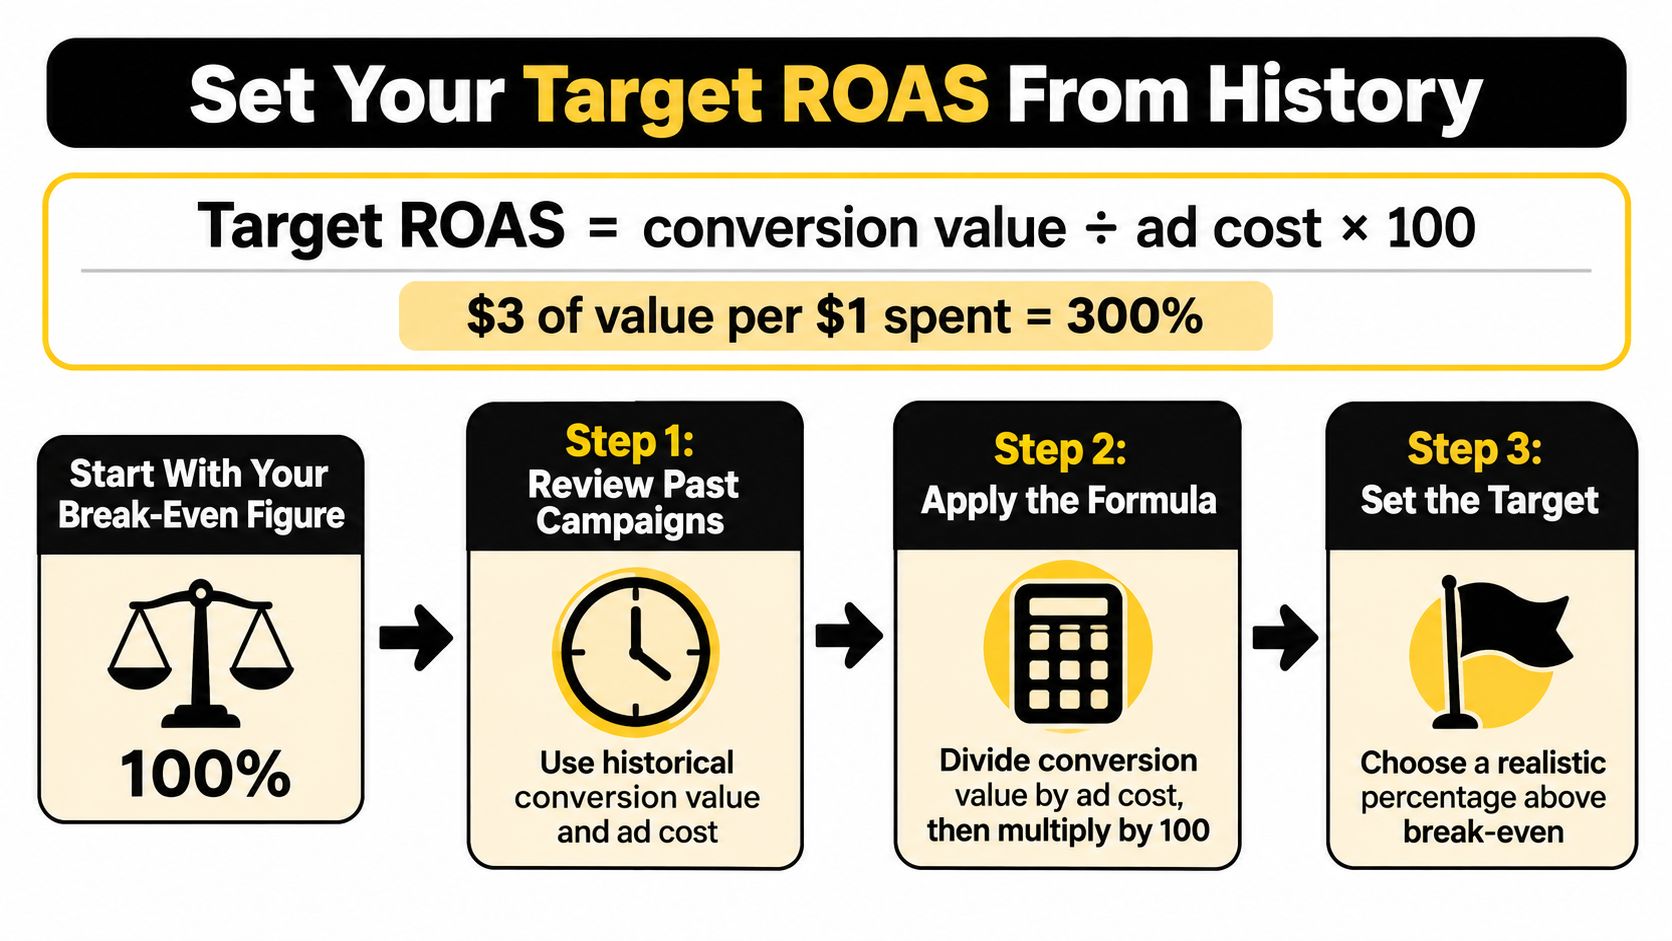
History is your reality check on that floor. Google's guidance on measuring Target ROAS performance says advertisers should report conversion values across relevant campaigns for four weeks or three conversion cycles, whichever is longer, before determining a target, then multiply the historical conversion value per cost by 100 to express it as a percentage. Google also advises setting the target at or below historical ROAS, because setting it above recent performance can restrict bidding and reduce conversion volume.
Three Steps to a Defensible Target
- Set your floor first: Take your break-even ROAS and add the buffer you need for overhead and profit. This is the lowest return the campaign can run at without eating cash.
- Pull your history: Gather conversion value per cost across the relevant campaigns over a full, representative window. Skip sale weeks and stock outage weeks if they distort the picture, and say so in your notes.
- Land at or below history: Pick a target between your floor and your historical figure. If history sits below your floor, don't wish the target upward, because the bidding will bid less and buy less.
Here's how that plays out in practice. Say your average order is $80 and your margin before ads is 40%, so break-even is 2.5x. Your campaigns have been running at 3.2x historically. A target of 3.0x, or 300%, sits above break-even with room for overhead, and it sits below recent performance so bidding shouldn't seize up. That's a target you can defend in a budget meeting.
If your floor comes out above your history, the honest options are raising order value, improving margin, cleaning wasted spend, or accepting that this campaign can't carry a profit target yet. For broader context on how bidding choices interact with ecommerce economics, PPC bidding advice from AI Optimization Services is worth reading alongside your own numbers. Don't borrow its tactics without checking them against your floor, though.
One thing underpins all of this. The value in the formula comes from your conversion tracking, so the target is only as good as the tracking behind it. Inflated values produce a target that looks achievable and means nothing. Undervalued conversions make the system underbid for customers you'd happily pay more to win.
Watch the first week after any change closely. Specific warning signs include:
- Conversion volume dropping sharply: The target is probably above what the auction will deliver at your budget.
- Cost per click climbing while volume holds: The system is chasing scarcer, higher value clicks, which may be fine if value per conversion rises too.
- Impressions shrinking on core terms: You're being priced out of queries that used to carry the campaign.
Give the change enough conversions to judge, but don't let a clearly broken week run on autopilot. Small adjustments beat dramatic swings. Move the target, observe, and let your own history keep voting on what a good ROAS is for your account.
How to Raise ROAS Without Cutting Off Volume
Raising ROAS is easy if you don't care about growth. Cut everything except branded search and remarketing, watch the ratio soar, and watch the business shrink. The actual job is improving return while keeping a healthy flow of new demand, and that starts with seeing through the blended average.
The blended number can hold steady while your next dollar gets less efficient, because high intent traffic flatters the account. Search Engine Land's reporting on 2025 Google Ads benchmarks found CPC increased from $4.66 to roughly $5.26 to $5.42 in 2025 while conversion rates reached about 7.52% to 8.18% depending on the dataset, and it notes Google reports advertisers switching from Target CPA to Target ROAS can see 14% more conversion value at a similar return. Treat that claim as a hypothesis to test in your account. It doesn't show which conversions the ads caused.
Here's a visual way to think about the gap between blended and incremental performance before you start pulling levers.

Lever 1 Split Brand From Non-Brand
This is the cheapest clarity you'll ever buy. Give branded and non-branded campaigns their own budgets and their own ROAS judgment. Brand will almost always look stronger because those searchers already know you. Once it's separated, you can see what prospecting earns and stop letting brand subsidize a weak non-brand program on paper. The trade-off is modest, mainly a bit more reporting discipline.
Lever 2 Work the Search Terms Report
Wasted spend often hides in plain sight. Pull the report and sort by cost. Junk keywords can be removed from the search terms report with a single click or a quick mouse highlight, and high-converting keywords can be added straight from the search terms report so proven queries get their own control, match type and ad copy.
Be careful with the negative side, though. Broad, sloppy negatives can block useful variations you never see again, and you'll mistake the resulting silence for efficiency. Add negatives at the level the evidence supports, and recheck them when products or offers change. For a structured pass through these fixes, our guide to increasing ROAS sequences the work so you don't trim demand you meant to keep.
Lever 3 Trim Segments Below Break-Even
Now the riskier lever. Review geography, device, and new versus returning customers, and pull back where performance sits below your break-even after a fair amount of data. This works when a segment is structurally unprofitable, such as when shipping costs kill margin in certain regions. It backfires when a segment needs a better landing page or a different offer.
The video below is worth watching for how practitioners frame these trade-offs before cutting anything.
Cutting spend improves the ratio and can shrink the business at the same time. Judge every cut by total contribution, not ROAS alone.
Underneath all three levers sits one habit. Think in terms of marginal ROAS, the return on the last slice of spend in each campaign, rather than the account average. When you raise a budget, ask what the extra money bought after branded, remarketing and already high intent traffic are removed. Run a simple before and after comparison for each change, keep the window consistent, and let search term coverage show you whether you're expanding profitable demand or just fencing in the demand you already had.
Set Your Own Target ROAS This Week
You don't need one target for the whole account. You need the target that matches each campaign's job. A campaign that must pay its own way gets a target built from break-even. A campaign carrying its share of salaries and software needs a cash flow positive target above that. A growth campaign chasing customers with strong, measured lifetime value can deliberately run lower, as long as payback is tracked and the cash exists to wait for it.
Lead generation deserves a stricter rule. Set conversion value from closed revenue, not form fills. If every lead carries the same invented value, the target rewards whoever produces the cheapest submissions, and your sales team inherits a pile of unqualified names while the dashboard glows green. Feed closed won value back, even imperfectly, and the whole system gets smarter about which clicks deserve money.
For the manual clean up in this plan, the Keywordme plugin works inside Google Ads, so users do not have to leave Google Ads, and signing up for the free trial gives instant access to the Keywordme Chrome plugin. That keeps the search terms work in the interface where you're already reviewing performance.
Your Two Week Plan
- Day 1: Pull your contribution margin by product line or service, subtract the variable costs you'd rather forget, and write down break-even ROAS where you'll see it.
- Day 3: Confirm conversion tracking sends consistent values, remove duplicates, and check your volume against the eligibility thresholds for your campaign types.
- Day 7: Review the search terms report sorted by cost. Remove junk queries, promote proven converters into their own keywords, and split brand from non-brand if you haven't yet.
- Day 14: Compare each campaign against break-even, not against the account average. Keep, raise or lower the target based on marginal performance and total contribution.
My recommendation comes down to your margin. If your margin is thin, start at break-even plus a real buffer and protect cash, because volume you can't afford isn't growth. If your margin is wide and volume is steady, run at or just below your historical figure and review weekly, nudging only when the data earns it. Either way, you've stopped asking strangers what your number should be, which is the whole point.
Ready to stop paying for clicks that never had a chance of clearing your break-even? Keywordme helps you clean junk search terms, promote proven queries and manage negative keywords right inside Google Ads, so more of your budget lands on traffic that can hit your target. Start your free trial at Keywordme and set your next ROAS target on cleaner data.
