Streamline SEO Keyword Reporting for Insights
Streamline SEO Keyword Reporting for Insights

You’re probably dealing with one of two reporting problems right now.
Either your SEO report is too thin and tells nobody anything useful, or it’s a bloated export stuffed with rankings, impressions, and screenshots that never turn into decisions. Both are common. Neither helps a team spend budget better.
That’s why seo keyword reporting has to do more than document movement. It has to explain what changed, why it matters, and what the team should do next. If it can’t do that, it’s not a report. It’s a filing exercise.
Given the significant growth, this subject demands serious consideration. The global SEO services market is projected to reach USD 234.8 billion by 2030 with a 17.6% CAGR, and one reason is the need for reporting that proves ROI. Even a tactical detail like title length matters, since titles of 40 to 60 characters can boost CTR by 8.9% according to G2’s SEO statistics roundup. Good reporting is what catches those opportunities before they get buried in noise.
Beyond Data Dumps The Goal of Good Reporting
The bad version of seo keyword reporting usually looks polished.
It has charts. It has branded colors. It has tabs for rankings, traffic, pages, countries, and “insights.” It also has no point. A client or executive opens it, scrolls for two minutes, and asks the only question that matters: what should we change?
That question is where most reports fall apart.
What executives actually want
Most stakeholders don’t need every keyword movement. They need a short answer to three things:
- What improved: Which keyword groups, landing pages, or themes are moving the business in the right direction.
- What slipped: Where visibility, clicks, or conversions weakened enough to warrant attention.
- What happens next: The action list, owner, and priority.
If your report doesn’t reach those three points fast, it’s too crowded.
Practical rule: If a stakeholder can’t find the recommended actions in under a minute, the report is doing too much and saying too little.
I’ve seen teams celebrate a rankings win while leads stayed flat. I’ve also seen a page lose average position while revenue improved because the remaining queries had stronger intent. That’s why raw ranking movement on its own is a weak story. Context is what turns a metric into a decision.
Reporting should reduce uncertainty
A useful report narrows the conversation.
Instead of “traffic is up,” it says the increase came from a non-brand cluster, the winning pages are service pages rather than blog posts, and the next move is to tighten internal links, improve titles, or test paid coverage for the terms showing commercial intent. That’s an operational update. People can act on it.
A report that just documents motion creates debate. A report that interprets motion creates momentum.
Here’s the trade-off. The more metrics you include, the safer the report can feel to the person building it. But the more metrics you include, the harder it becomes for everyone else to spot the signal. Good reporting is selective on purpose.
The standard I use
A strong seo keyword reporting process should leave the reader with:
| Report element | What it should answer |
|---|---|
| Performance summary | Did search visibility and business outcomes move in the right direction? |
| Key drivers | Which keywords, pages, or topics caused that movement? |
| Risks | What dropped, stalled, or became less efficient? |
| Decision list | What gets updated, tested, paused, or escalated next? |
That’s the difference between a report that gets filed away and one that changes what the team does this week.
First Set Goals Then Choose Your KPIs
If the goal isn’t clear, KPI selection turns into guesswork.
A lot of seo keyword reporting goes wrong before anyone opens Google Search Console. Teams pull whatever the tools make easy to export, then try to build a narrative backward from the data. That’s why reports drift into vanity metrics.
Start with the business goal. Then choose the SEO goal that supports it. Then pick the KPI that proves progress.
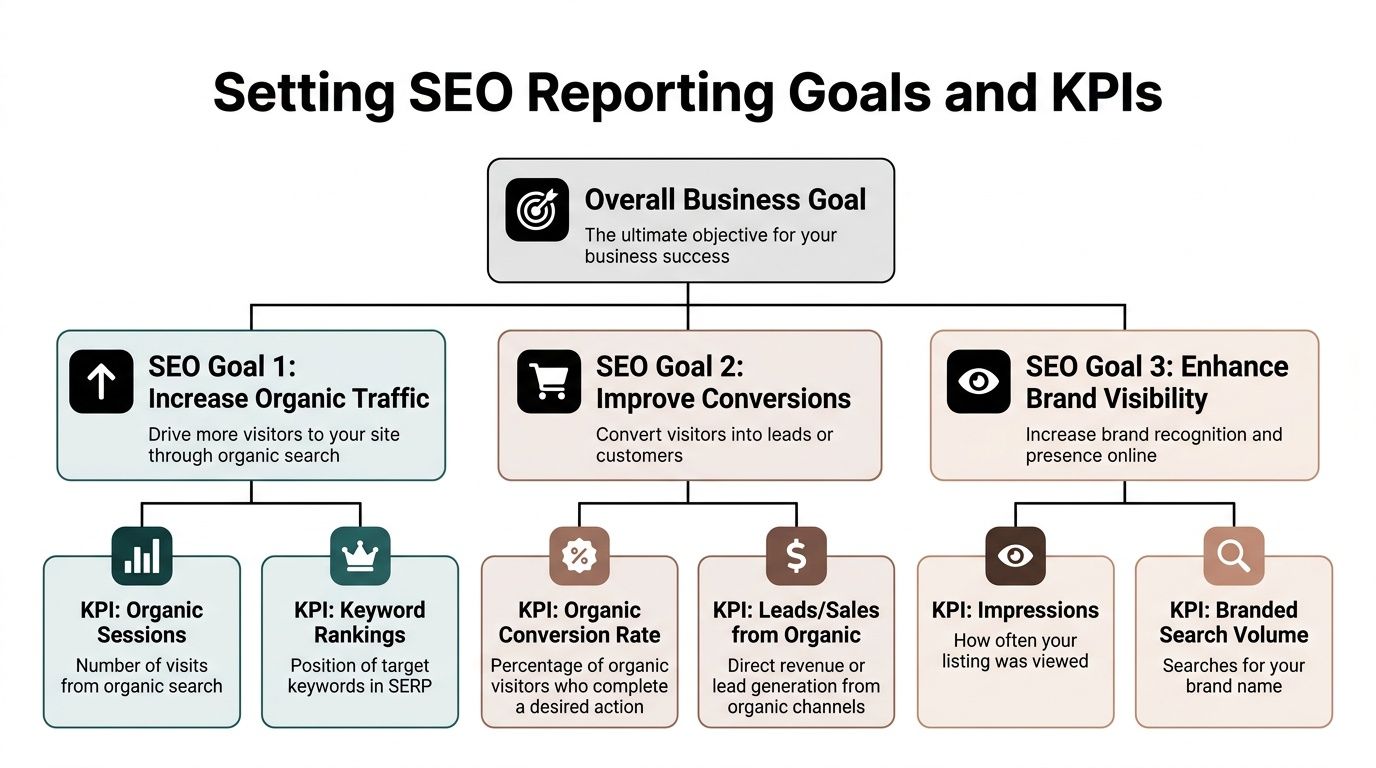
Pick KPIs that match the outcome
Organic search drives 94% of all clicks on SERPs, which is why reporting needs to stay focused on the metrics that capture search opportunity. Featured snippets also matter because they have the highest reported CTR at 42.9% according to Marketing LTB’s SEO statistics roundup. That doesn’t mean every report should obsess over snippets. It means the KPI should reflect the goal.
If the business needs pipeline, you care about conversions and qualified traffic. If the business needs category visibility, you care about rankings, impressions, and SERP features. If local discovery matters, local query visibility belongs in the report.
A simple hierarchy that keeps reports sane
Use this structure every time:
Business goal
Revenue, lead quality, market visibility, retention, store visits, or pipeline support.SEO goal
Grow qualified organic traffic, improve rankings for commercial topics, increase visibility for core product terms, or capture more branded demand.Primary KPI
One metric that best reflects whether the SEO goal is working.Supporting metrics
The context metrics that explain why the primary KPI moved.
This sounds basic, but it prevents the classic mistake of turning every export into a KPI.
Key Performance Indicators for SEO Reporting
| KPI Category | Primary KPI | Supporting Metrics |
|---|---|---|
| Traffic growth | Organic clicks or organic sessions | Impressions, CTR, average position, landing pages |
| Conversion impact | Organic conversions or key events | Conversion rate, top converting pages, query intent themes |
| Visibility | Rankings for priority keywords | Share of voice, impressions, top 10 presence, SERP features |
| Brand presence | Branded search visibility | Branded clicks, branded impressions, branded CTR |
| Content efficiency | Clicks by page or keyword cluster | Page CTR, average position, title performance |
| Local performance | Local keyword visibility | Clicks from local pages, impressions for local queries |
What to leave out of the spotlight
Some metrics belong in the appendix, not the headline.
- Total keywords tracked: Useful for operations. Weak as a lead KPI.
- Impressions alone: Helpful for visibility context. Not enough to prove value.
- Average position across everything: Fine for pattern spotting. Too blunt for executive reporting.
- Tool-specific authority scores: Sometimes directionally useful. Rarely decisive in meetings.
A report improves when fewer numbers fight for attention.
A clean report doesn’t mean a shallow report. It means every metric earns its place.
Match the KPI to the audience
Executives usually want trend, impact, and next action.
Channel managers want cluster-level movement, page-level opportunities, and diagnostic detail. A content lead wants to know which briefs need revision. A paid media lead wants to know which organic queries deserve ad testing. Same source data, different framing.
That’s why I split reports into two layers:
- Summary layer: A short view for decisions
- Working layer: The deeper tabs for the team doing the work
If you mix both into one cluttered presentation, nobody gets what they need.
Gathering and Cleaning Your Keyword Data Sources
You can’t build solid seo keyword reporting on a single tool.
Every platform lies a little. Not maliciously. Just structurally. Google Search Console is closest to the source for search performance, GA4 tells you what happened after the click, and third-party tools fill in the competitive view that Google won’t give you directly. Treat any one of them as complete truth and you’ll make bad calls.

Start with the big three
I build most reporting stacks around three source types.
Google Search Console for search reality
GSC is where you get the basics that matter most to SEO teams:
- Clicks
- Impressions
- CTR
- Average position
- Query and page relationships
It’s the first place I look when someone says traffic dropped or a page “should be doing better.” GSC usually shows whether the issue is visibility, CTR, or query mix.
Its limitation is obvious. It doesn’t tell the full business story once a visitor lands.
GA4 for post-click behavior
GA4 picks up where GSC stops.
Use it to understand whether the traffic from a keyword theme or landing page is useful. That means looking at conversions, engaged sessions, key events, and destination pages. If GSC says a query cluster is getting traction but GA4 shows poor quality after the click, the issue may be mismatch between search intent and page experience.
At this point, a lot of reports improve quickly. They stop treating traffic as the finish line.
Third-party tools for discovery and competition
Ahrefs, Semrush, and similar platforms help in areas where Google stays quiet.
They’re useful for:
- competitor keyword overlap
- historical ranking views
- estimated visibility trends
- content gap analysis
- keyword discovery beyond your current footprint
That doesn’t make them a replacement for first-party data. It makes them a supplement.
Cross-validation isn’t optional
When building a report, you should cross-check major findings between sources. Ranking data can vary by 15% to 25% between GSC and third-party tools, and a stronger methodology can reveal 20% to 30% more keyword data hidden by privacy filters according to We Are TG’s write-up on SEO reporting.
That’s a practical warning. If a third-party rank tracker says a term climbed but GSC doesn’t show improved clicks or impressions, don’t rush into a victory slide. Validate first.
Don’t report tool outputs as facts. Report patterns confirmed across sources.
Handle the not provided problem like an adult
Keyword-level visibility after the click has been messy for years. That doesn’t mean you’re blind. It means you need to work with joined data instead of expecting a perfect keyword-to-conversion chain inside one platform.
My usual approach is simple:
- Map GSC queries to landing pages
- Map landing pages to GA4 conversions
- Group terms into intent-based clusters
- Review outcomes at page and cluster level
This gives you a usable view even when the direct keyword trail is incomplete. If you need a deeper walkthrough on the analytics side, this breakdown of https://www.keywordme.io/blog/keyword-not-provided-analytics is worth reviewing before you finalize your reporting logic.
Clean the data before you analyze it
Messy exports create fake insights.
Common cleanup work includes:
- Normalize brand terms: Separate branded and non-branded queries early.
- Consolidate duplicates: Similar queries often splinter the same theme.
- Tag intent: Informational, commercial, navigational, and transactional buckets make reports easier to interpret.
- Map by page type: Blog, service, category, product, location, and support content behave differently.
- Set a date discipline: Compare like-for-like periods. Don’t mix partial months with full months.
A clean workbook beats a flashy dashboard built on junk inputs.
Build one source of truth for clusters
Keyword-level exports become noisy fast. Cluster-level reporting is usually more useful.
For example, instead of tracking dozens of slight query variations separately, group them under one topic or commercial theme. That helps you answer better questions:
- Is the cluster gaining visibility?
- Is CTR rising or falling for that theme?
- Which page owns the cluster now?
- Should SEO improve the page, or should paid search test the opportunity first?
That’s where reporting starts becoming operational.
Keep a research workflow nearby
If your team struggles to expand beyond existing terms, it helps to keep a practical resource on hand for how to do keyword research so your reporting doesn’t become trapped by the current keyword set. Reporting is stronger when it feeds new targeting ideas, not just status updates.
What I trust most by use case
| Use case | Best starting source | Why |
|---|---|---|
| Query visibility | Google Search Console | Closest view of search impressions, clicks, CTR, and positions |
| Conversion quality | GA4 | Shows what users do after they arrive |
| Competitor overlap | Third-party SEO tool | Useful for terms and pages you don’t currently own |
| Trend validation | GSC plus GA4 | Best for checking whether ranking movement produced business impact |
| Opportunity clustering | GSC export plus spreadsheet | Easier to group by intent, page, and business priority |
If you skip the cleaning step, the reporting will look more precise than it really is. That’s usually where confidence outruns accuracy.
Building Your Report Dashboards vs Spreadsheets
The format matters more than people admit.
I like dashboards. I also don’t think dashboards solve everything. Some teams cram every SEO metric into Looker Studio, call it automation, and then wonder why nobody can interpret the output. Other teams stay in spreadsheets forever and bury useful patterns in endless tabs. Both setups can work. Both can also turn into a mess.

When dashboards are the right choice
Dashboards are strongest when a team needs ongoing visibility without manual assembly every week.
Looker Studio is the common option because it connects well to Google properties. A good dashboard helps a lead or manager answer questions quickly:
- Are clicks trending up or down?
- Which pages gained visibility?
- Which query clusters slipped?
- Is branded traffic masking a non-brand problem?
- Did CTR improve after title updates?
Dashboards work best for monitoring. They’re less effective for deep diagnosis unless the build is very disciplined.
What I put on a useful dashboard
A dashboard for seo keyword reporting should stay tight. I’d rather include fewer views with better labels than build a giant interface no one trusts.
Core components I like:
- Executive summary panel: top changes, risks, and actions
- Trend section: clicks, impressions, CTR, and average position over time
- Landing page view: page performance with change indicators
- Keyword cluster view: grouped themes, not just raw terms
- Filters: brand vs non-brand, device, region, page type
If your team is evaluating software choices for this setup, this guide to https://www.keywordme.io/blog/best-tools-for-keyword-performance-tracking is a practical place to compare reporting and tracking options.
Where spreadsheets still win
Spreadsheets are slower to impress and much better for thinking.
Google Sheets or Excel is where I do the core analysis. It’s easier to annotate patterns, classify keywords, group by intent, score opportunities, and keep clean historical snapshots. A spreadsheet also makes it easier to show your work when someone challenges a conclusion.
Dashboards are where people consume the story. Spreadsheets are where analysts prove it.
For monthly reporting, I often use both. Dashboard for visibility. Spreadsheet for diagnosis and action planning.
Side by side trade-offs
| Format | Best for | Weak spot |
|---|---|---|
| Dashboard | Monitoring trends and stakeholder access | Can hide nuance and create shallow interpretation |
| Spreadsheet | Deep analysis and action planning | Harder for executives to scan quickly |
| Slide summary | Decision-making meetings | Needs a strong source workbook behind it |
Don’t confuse visuals with clarity
A lot of reporting design mistakes come from trying to make SEO “look strategic” instead of making it understandable.
Avoid these common habits:
- Too many chart types: One clean line chart beats five decorative visuals.
- No annotations: A traffic dip with no note about a title rewrite, migration issue, or seasonal event isn’t helpful.
- Metric overload: If every KPI is equal size on the page, none of them is important.
- Unsorted tables: Put the most important movers first.
A useful report guides the eye. It doesn’t ask the reader to discover the point on their own.
This walkthrough is a good example of how people structure reporting views in practice:
My preferred reporting stack
For a typical team, I’d use:
- A live dashboard for weekly visibility
- A working spreadsheet for keyword clusters, page mapping, and opportunity notes
- A short monthly summary with decisions and owners
That mix handles both audiences. Executives get clarity. Practitioners get enough depth to act.
The mistake isn’t choosing dashboards over spreadsheets or the other way around. The mistake is expecting one format to serve every reader equally well.
Automating Reports and Interpreting Trends
Manual reporting burns time fast.
If someone on your team is still exporting the same tabs every week, cleaning the same columns, and rebuilding the same charts by hand, that person is spending energy on assembly instead of analysis. Automation fixes that, but only if the output is built around decisions rather than convenience.
Automate the pull, not the thinking
The obvious layer is scheduled delivery.
Organizations can automate recurring exports or dashboard refreshes from Google Search Console, GA4, Looker Studio, and rank tracking tools. More advanced setups pull directly from APIs, especially when a team wants daily snapshots or custom blends that standard connectors don’t handle well.
For trend analysis, long-tail keywords often deserve their own filters because they can convert 2.5x better than head terms, and enterprise reporting setups often use APIs for daily pulls to catch anomalies like more than 10% ranking volatility according to Search Engine Land’s piece on SEO data pitfalls.
That’s a good benchmark for what automation should do. Surface movement early enough to investigate before it turns into a monthly surprise.
Build alert logic around real risks
Automation gets useful when it flags exceptions, not when it sends more clutter.
I like simple alert categories:
- Visibility risk: A priority page or keyword cluster drops sharply.
- CTR issue: Impressions rise while CTR weakens, often pointing to title or snippet problems.
- Intent mismatch: Clicks rise but conversions soften.
- Page cannibalization: Two pages begin sharing or splitting the same cluster awkwardly.
These alerts don’t need to be fancy. They need to be trusted.
Read trends in sequence
A lot of marketers read reports sideways. They jump straight to rankings and stop there.
A better read order is:
Check business outcomes first
Did conversions, qualified traffic, or lead-driving pages improve?Move to search inputs
Review clicks, impressions, and CTR by cluster and landing page.Look for structural causes
Was there a content change, title rewrite, indexing issue, internal linking shift, or SERP change?Assign the next move
Update content, revise metadata, consolidate pages, or push a PPC test.
That sequence keeps reporting tied to action instead of curiosity.
If a trend has no likely cause and no next step, it belongs in monitoring, not in the headline summary.
Separate noise from signal
Not every movement deserves a meeting.
Some fluctuation is normal, especially on broad or volatile terms. The key skill is knowing when a pattern repeats across a cluster, a page type, or a commercial topic. That’s usually when a change is meaningful enough to escalate.
I trust repeated movement across related terms more than a single keyword jump. I trust a CTR shift on an important page more than vanity ranking gains on a low-value query. And I trust changes that line up across GSC and GA4 more than anything isolated inside a third-party tool.
Automation helps you spot the smoke. Interpretation tells you whether there's a fire.
Bridge the Gap Link SEO Data to PPC Strategy
This is the part many teams miss.
They treat SEO reporting as one channel’s internal homework, then build paid search plans somewhere else with separate inputs, separate language, and separate priorities. That split wastes good data. Strong seo keyword reporting should feed PPC decisions directly.
An overlooked angle in reporting is connecting automation to PPC workflows like bulk handling and campaign expansion from real-time search data. That matters because it can cut optimization time by up to 10x according to Outrank’s discussion of keyword gap analysis and PPC workflow gaps.
Where SEO data helps paid search most
The handoff is practical, not theoretical.
Use organic reporting to spot:
- High-impression, low-CTR terms: These may deserve ad testing if the query has commercial intent.
- Emerging search language: If new queries start appearing in GSC, paid teams can test coverage before SEO fully matures.
- Weak-fit terms: Queries that bring visibility but poor engagement can inform negative keyword lists in Google Ads.
- Page-level winners: If an organic landing page converts well, align ad traffic to the same page or a close variant.
That’s the bridge. SEO shows what the market is asking. PPC lets you act faster on the highest-priority signals.
A workflow that actually works
I’d run the connection like this:
- Review organic query clusters weekly.
- Pull out commercial and near-commercial terms.
- Separate clean opportunities from junk intent.
- Send high-fit terms to paid search for testing.
- Send low-fit terms to negative keyword review.
- Compare paid and organic landing page behavior.
Teams that still frame this as “SEO vs PPC” usually leave money on the table. This explainer on SEO vs Paid Ads is useful if you need a straightforward way to think about how the channels support different parts of the same search strategy.
For a more direct look at how the two channels work together in practice, https://www.keywordme.io/blog/seo-and-paid-search is worth reading alongside your reporting process.
The best search programs don’t ask which channel gets credit first. They ask which signal should change bidding, targeting, or content right now.
When organic and paid teams share keyword reporting, wasted spend usually becomes easier to spot. So do faster wins.
Quick Answers to Common Reporting Questions
How often should seo keyword reporting be reviewed
An effective review schedule typically includes a weekly light review and a monthly deeper review. Weekly checks catch issues early. Monthly reporting gives enough time to judge whether a change is part of a real pattern.
Should I report on every keyword
No. Report on priority keywords, clusters, and landing pages. Keep the full keyword list in a working tab if the team needs it.
What matters more, rankings or conversions
Conversions matter more. Rankings are useful when they explain traffic quality, visibility growth, or missed opportunity. On their own, they’re incomplete.
Should branded and non-branded keywords be separated
Yes. If you mix them, branded demand can make the overall report look healthier than it is.
What’s the most common reporting mistake
Treating exports as insights. A report becomes valuable when it explains the cause, the business impact, and the next action.
Keywordme helps teams turn messy search term data into action inside Google Ads. If your seo keyword reporting keeps surfacing PPC opportunities but your workflow for negatives, match types, and bulk keyword cleanup is still manual, Keywordme is built to speed that up without the usual copy-paste chaos.