
Comparison of Performance a Guide for Google Ads
Comparison of Performance a Guide for Google Ads


A campaign with a 21.66% CTR can still be a poor investment if those clicks don't produce valuable actions. A lower-visibility campaign can create more useful leads, stronger revenue, or a healthier return. That's why the most popular advice about performance comparison, “find the biggest metric and call it the winner,” is usually wrong.
A reliable comparison of performance starts with a business question. Are you trying to build awareness, generate leads, protect profit, or discover new demand? Once that goal is clear, compare campaigns under the same conditions, inspect the data behind the headline metrics, and account for what Google Ads no longer reports. The process is closer to controlled benchmarking than casual dashboard reading, a principle with a long history in science, computer science, and business performance comparison methodology.
| Comparison area | Useful question | What can mislead you |
|---|---|---|
| CTR and engagement | Are the ads attracting relevant attention? | Curiosity clicks may not convert |
| Conversion rate and CPA | Are visitors taking the desired action efficiently? | Tracking settings can distort results |
| ROAS and revenue | Is paid traffic producing profitable value? | Revenue quality and margins may differ |
| Search terms | What demand is the campaign actually capturing? | Some low-activity terms may be hidden |
| Timeframe | Has each campaign had enough time to settle? | New automation can still be learning |
Why Your Performance Metrics Are Lying to You
The problem isn't that Google Ads metrics are useless. The problem is that marketers often ask them to answer questions they weren't designed to answer.
A high CTR tells you that people clicked relative to the times your ad appeared. It doesn't tell you whether those visitors were qualified, whether the landing page persuaded them, or whether the resulting customers were profitable. A campaign can attract broad curiosity while sending weak traffic to the site. Meanwhile, a tightly targeted campaign may receive fewer clicks but produce better commercial outcomes.

The metric only makes sense beside its job
Start with the decision you need to make. If the question is, “Which campaign creates awareness?” impressions, reach, and CTR may be useful indicators. If the question is, “Which campaign generates profitable customers?” those metrics belong lower in the analysis, behind conversion value, cost, margin, and the quality of the customers acquired.
That distinction changes how you compare two campaigns. You're not asking which one has the most impressive dashboard. You're asking which one performs better against the same objective, audience, budget logic, attribution setup, and measurement window.
Practical rule: A metric is only “good” when it supports the decision your business needs to make.
Surface-level wins often hide a second story
Suppose one ad group has a stronger CTR but a weaker conversion rate. That doesn't automatically mean the ad copy is better or worse. The difference could come from keyword intent, position, device mix, geography, landing-page experience, or the type of query being matched.
Reporting also needs context. A month-over-month view with delta columns can help you see whether a metric changed meaningfully, while conditional formatting makes unusual movements easier to investigate. The best practices for reporting are useful here because a report should guide action, not just display a collection of green and red cells.
The same principle applies beyond advertising. A practical guide to choosing website optimisation can help connect campaign results to the landing-page experience that follows the click. If the page fails to support the promise in the ad, changing bids alone won't solve the underlying issue.
The honest conclusion may be that the data doesn't support a winner yet. That's better than giving stakeholders a confident answer based on a metric that measures attention while the business needs revenue.
Choosing Your North Star Metrics by Goal
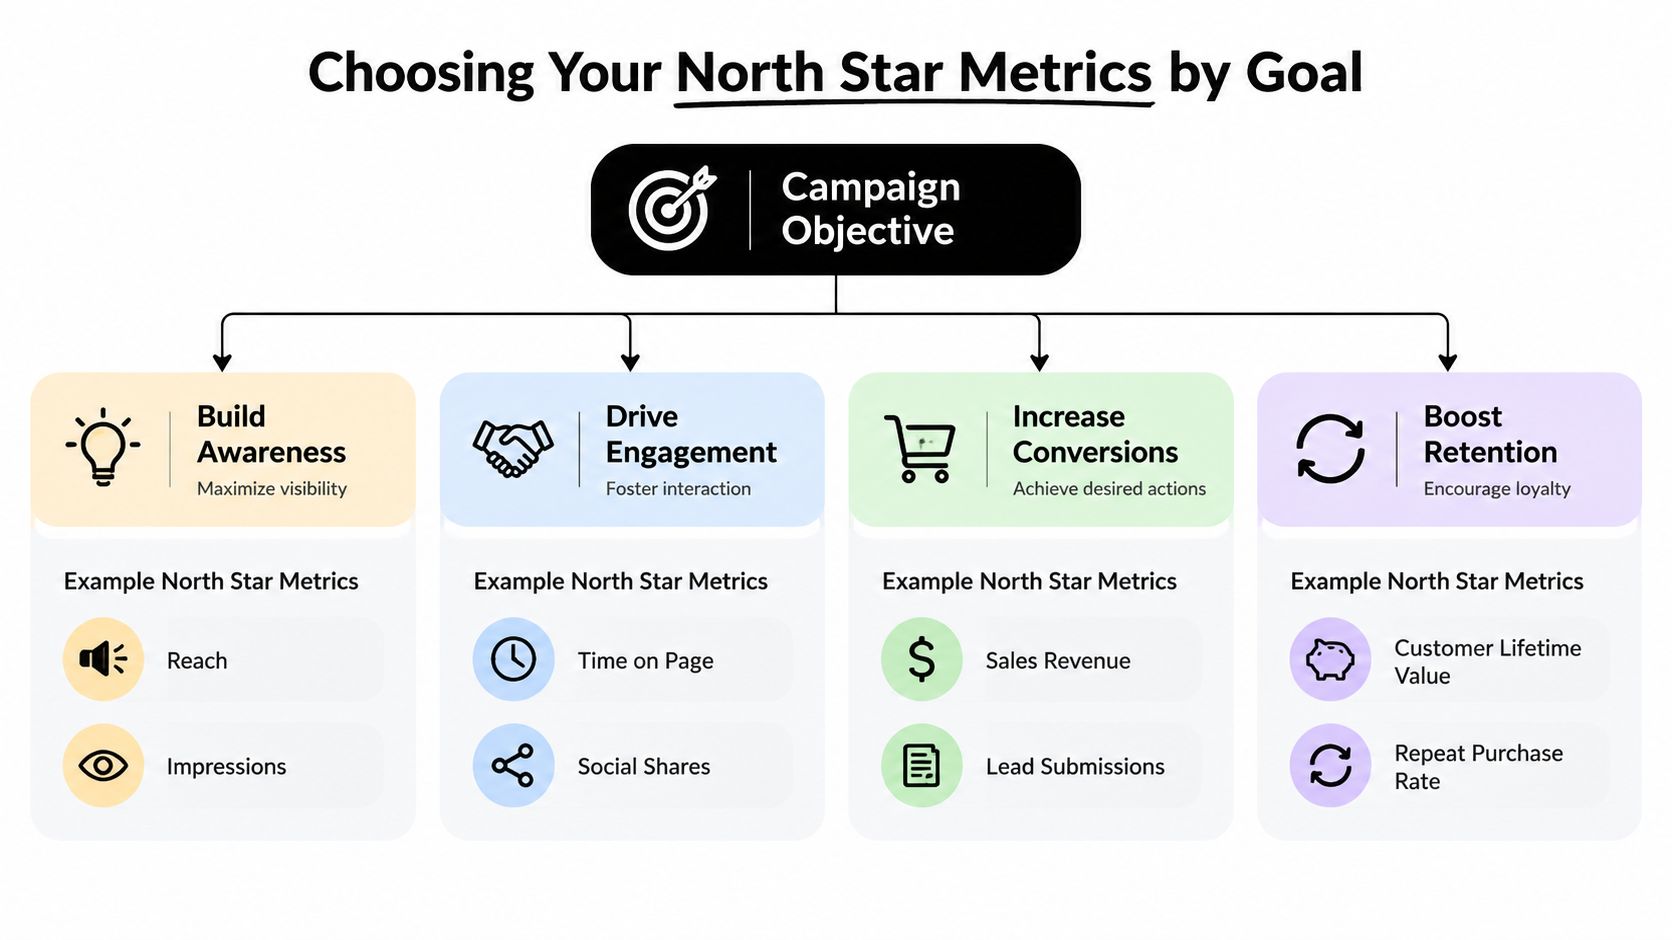
A campaign can look successful while optimizing for the wrong outcome. Choose the business result first, make it your North Star, then use supporting metrics to explain movement around it. The right comparison starts with a clear decision, such as whether to increase budget, improve lead quality, or protect profit.
Benchmarking only works when the baseline reflects comparable conditions. Compare like with like, including objective, audience, budget logic, attribution setup, and measurement window. A benchmarking framework can compare multiple data sets and turn raw measurements into signals of improvement, decline, or stability benchmarking fundamentals. In Google Ads, that framework is useful only when the baseline matches the business goal and the conversion definition has stayed consistent.
Brand awareness
For awareness campaigns, use impressions, reach, and CTR as the starting set. Impressions show delivery, reach shows how many users encountered the message, and CTR provides a directional signal of interest.
CTR should not become the final verdict. Loose targeting can generate clicks from people outside the audience you can realistically serve. Review placement, audience, geography, and frequency where available, then judge whether the exposure is building attention among potential customers. If the campaign's purpose is broad visibility, a lower CTR may be acceptable when the reach is relevant. If the goal is qualified traffic, that same result needs closer scrutiny.
Lead generation
Lead campaigns usually need conversion rate, qualified lead volume, and CPA. Conversion rate shows how efficiently the landing experience turns visits into recorded actions. CPA shows the cost of each recorded acquisition, but the comparison is useful only when every campaign counts the same type of conversion.
A form submission does not automatically represent a sales opportunity. One campaign may produce many inexpensive enquiries, while another generates fewer prospects that sales can pursue. Connect offline qualification or sales outcomes to campaign reporting whenever possible. Keep the conversion action consistent, and separate raw lead volume from qualified lead volume before reallocating budget.
Profitability
For ecommerce and revenue-focused campaigns, prioritize ROAS and conversion value. ROAS relates advertising cost to recorded revenue, while conversion value captures the amount generated by tracked actions.
Revenue is not the same as profit. Product margins, repeat-purchase potential, fulfilment costs, and refund rates can change the commercial result. A campaign with strong ROAS may sell low-margin products, while a campaign with a modest return may attract customers with greater long-term value. Compare performance against the business economics, not against platform revenue alone.
Build a measurement hierarchy
Use one primary metric and a short diagnostic set:
- Primary outcome: The result that determines whether the campaign merits more investment.
- Efficiency measure: The cost or return metric showing how economically the campaign reaches that outcome.
- Quality check: A signal confirming that the recorded result has commercial value.
- Delivery context: Impressions, clicks, position, device, location, or audience data explaining the movement.
A useful report answers three questions quickly: what changed, why it changed, and what action follows. If every metric receives equal weight, the report cannot guide a clear decision. When search term data is incomplete or platform features change, document the limitation instead of treating an uncertain comparison as a firm conclusion.
The Nuances of Key Performance Metrics Compared
Metrics often improve in different directions because they describe different stages of the customer journey. Comparing them requires an understanding of the trade-off, not a simplistic ranking.
CTR versus conversion rate
CTR measures response to the ad. Conversion rate measures the next step after the click. A high CTR may indicate strong relevance, a compelling offer, or a message that attracts broad interest. A high conversion rate suggests that the traffic and landing experience align more closely with the intended action.
High-intent searches can behave differently from exploratory searches. A tightly matched query may produce fewer total clicks while converting efficiently. Broad discovery can introduce useful new demand, but it can also bring in searches that sound related without showing buying intent.
A campaign that wins the click but loses the customer hasn't won the comparison.
Exact match deserves careful attention when efficiency matters. A large Google Ads benchmark reported exact match at 415% ROAS and 21.66% CTR, the highest figures among the match types in that benchmark Google Ads match type benchmark. That result doesn't mean exact match should replace every other approach. It shows why reach and efficiency need to be evaluated as separate objectives.
CPA versus ROAS
CPA is usually the clearest metric for lead acquisition. It answers, “What did it cost to obtain the recorded action?” That's useful when leads have a reasonably consistent value and the sales process can assess quality later.
ROAS is more suitable when conversion values are available and revenue is the immediate optimization target. It answers, “How much tracked revenue came back for the advertising cost?” It can still mislead when product margins differ or when revenue tracking omits refunds, repeat purchases, or offline value.
| Metric | What it measures | Best for goal | Common pitfall |
|---|---|---|---|
| CTR | Click response relative to ad exposure | Awareness and relevance | Treating attention as business value |
| Conversion rate | Recorded actions relative to clicks | Landing-page and traffic efficiency | Ignoring lead quality |
| CPA | Cost per recorded acquisition | Lead generation | Comparing unlike conversion actions |
| ROAS | Tracked conversion value relative to cost | Revenue efficiency | Confusing revenue with profit |
| Impression share | Visibility against available opportunities | Delivery and coverage | Chasing reach without intent |
| Search terms | Queries that triggered ads | Relevance and waste control | Assuming the report is complete |
The practical choice is simple. Use CPA when the action has a stable value and lead volume matters. Use ROAS when conversion value is trustworthy and revenue efficiency drives the decision. Use both when the account needs to balance acquisition cost with commercial value.
How Attribution and Timeframes Skew Results
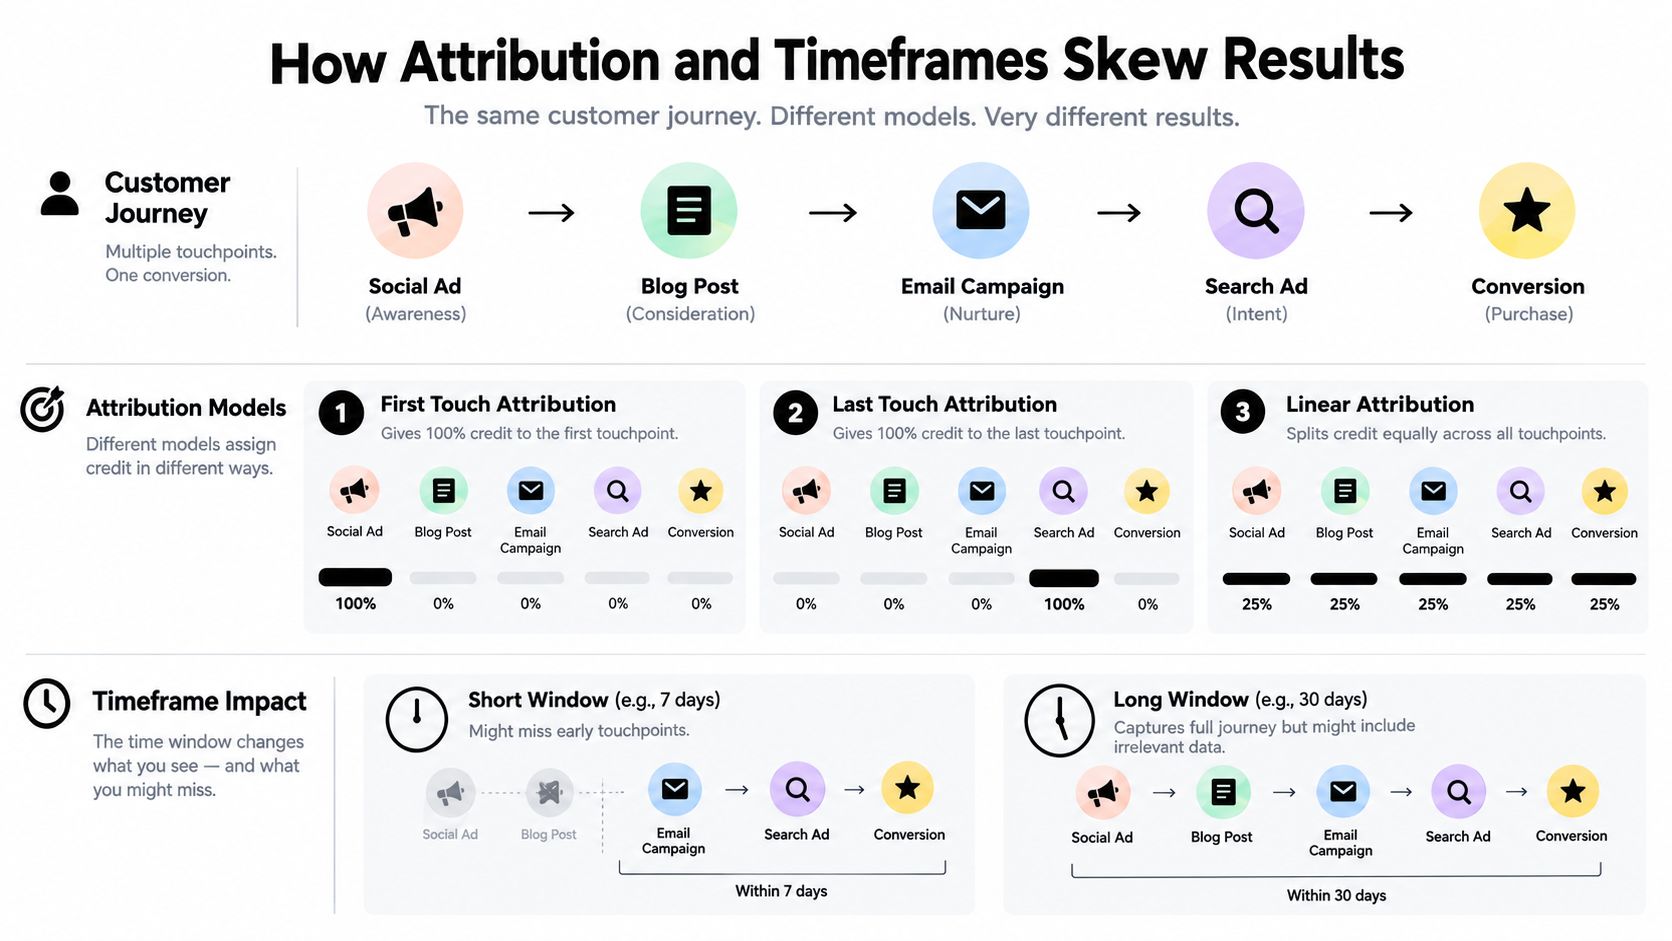
Two campaigns can appear to have different results even when they influence the same customer journey. Attribution decides how conversion credit is assigned, while the comparison window decides which interactions enter the analysis.
A last-click view gives the final interaction most of the credit. A data-driven model distributes credit according to observed paths. Neither view should be treated as a universal truth. The important requirement is consistency. Compare campaigns under the same attribution model, conversion action, conversion window, and counting settings.
Keep the measurement rules identical
Before comparing results, check:
- Conversion definitions: Make sure both campaigns optimize toward the same action.
- Attribution model: Don't compare results produced under different credit-allocation rules.
- Conversion windows: A shorter window may exclude delayed actions, while a longer one may include interactions that are less relevant to the campaign period.
- Reporting date: Confirm whether you're comparing interaction date or conversion date.
- Value rules: Make sure conversion values are calculated consistently.
Don't rush an automated campaign comparison
New campaigns need time to collect enough signals and move through early learning behaviour. Google's guidance recommends waiting at least 6 weeks before benchmarking a new campaign against an existing campaign, especially when comparing Performance Max with established activity Google's Performance Max comparison guidance.
That timeframe isn't permission to ignore obvious problems. Fix broken tracking, irrelevant traffic, policy issues, and severe budget constraints immediately. It does mean you shouldn't declare a strategic winner based on a short, unstable launch period.
Search reporting adds another complication. Google Search increasingly interprets intent rather than presenting every query as a perfect record of the user's exact wording. A campaign may appear to improve because the platform changed what it exposes, how it groups demand, or how it assigns credit.
For cross-channel programmes, document the model before you judge performance. The cross-channel attribution framework provides useful context for avoiding inconsistent comparisons across paid search, social, email, and other touchpoints.
Uncovering Hidden Insights with Segmentation
A campaign average can hide the segment that deserves more budget. Segmentation turns a broad result into a set of smaller comparisons, each tied to a practical decision.
Start with one dimension at a time. If you slice the account by device, location, audience, hour, network, and match type simultaneously, you may find patterns but struggle to explain them. Make one cut, identify a plausible cause, then test the action rather than treating every difference as proof.
Device and location
Compare mobile and desktop using the same primary metric. For lead generation, inspect conversion rate and CPA, then review the form experience and page speed for the weaker device. A mobile segment with lower conversion efficiency may need a landing-page fix, not an immediate bid reduction.
Location segmentation can reveal local concentration. Compare regions, cities, or service areas with enough activity to support a sensible conclusion. If one area produces stronger lead quality, consider separate messaging, budgets, location-specific landing pages, or tighter geographic controls.
Audience and intent
Audience segments can explain why the same keyword behaves differently. Existing customers, remarketing users, in-market audiences, and first-time visitors may have different expectations and conversion paths. Compare value and quality, not only the number of conversions.
Search intent is especially important when comparing match types. Research indicates that broad match generally underperforms exact match on CTR, while its negative effect on conversion rate is less severe for higher-position keywords, making broad match a possible discovery tool when it's controlled carefully match type effectiveness research.
A repeatable inspection sequence
Use this order when a campaign average looks disappointing:
- Confirm the outcome: Check whether the primary conversion is recorded consistently.
- Split by device: Look for a meaningful experience or intent difference.
- Split by location: Identify areas with stronger commercial response.
- Review audience behaviour: Separate new demand from returning users.
- Inspect queries and match types: Find irrelevant themes and promising expansion areas.
- Apply a controlled change: Adjust one variable and record the expected result.
The strongest segment isn't automatically the one with the best percentage. Small pockets can look spectacular while contributing little useful volume. Compare scale, quality, cost, and repeatability before reallocating budget.
How to Benchmark and Interpret Your Results
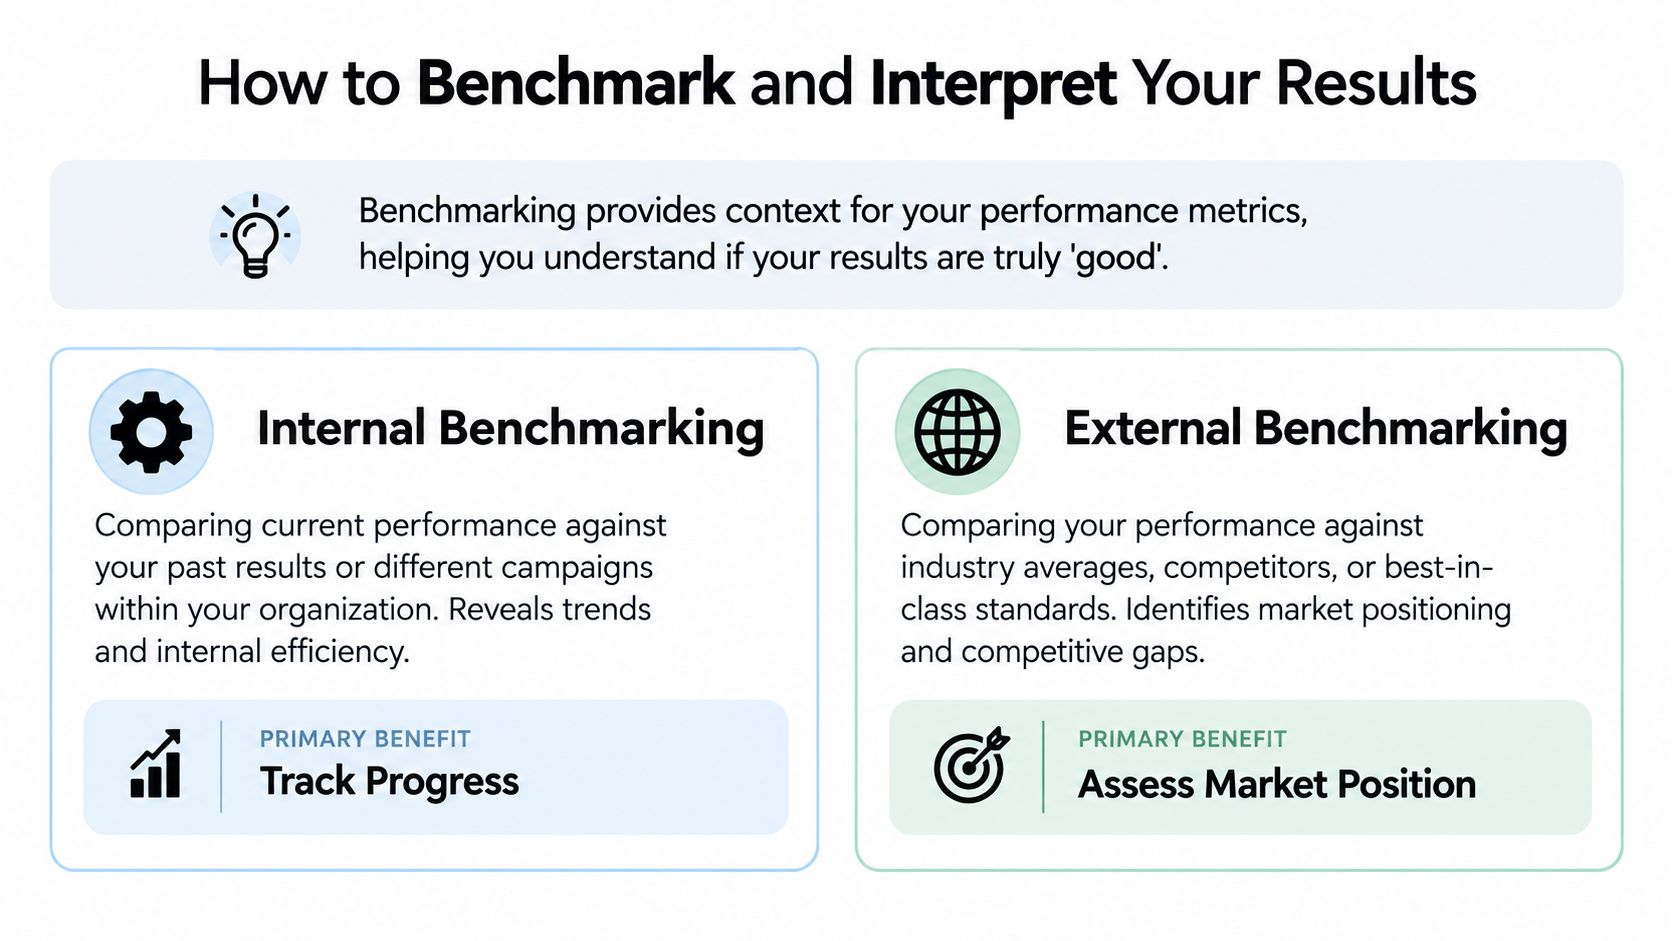
“Are these results good?” has no useful answer without a reference point. Start with an internal benchmark, then use external context to understand market position.
Internal benchmarking compares current performance with the account's own history, another campaign, or a previous structure. It's usually the cleanest way to measure progress because the business, offer, tracking environment, and commercial constraints are more likely to resemble the current situation.
External benchmarking can help with expectation setting, but industry averages rarely account for differences in intent, brand strength, margins, geography, landing-page quality, or conversion definitions. Use external figures as a prompt for investigation, not as a target that overrides your own economics.
Treat Google's search-term data as incomplete
Google Ads reporting now omits some low-activity search terms, including terms that may have generated clicks. That limitation means a direct comparison can understate waste and miss long-tail queries, so the visible search-term report isn't a complete explanation of spend Google Ads Search Terms report guidance.
This changes the optimisation workflow. Don't conclude that a campaign has clean query coverage because the visible terms look relevant. Compare spend, conversion performance, search categories, landing-page behaviour, and negative-keyword activity. Maintain a record of exclusions and changes so future comparisons show what the platform's current report cannot.
Turn analysis into a decision log
For every comparison, write down:
- The business goal: The outcome that determines success.
- The comparison set: Campaigns, ad groups, periods, devices, or audiences being compared.
- The measurement rules: Attribution, conversion actions, values, and windows.
- The data limitation: Missing terms, delayed conversions, tracking gaps, or learning periods.
- The decision: Increase, reduce, restructure, test, or wait.
- The next check: The evidence you'll review after the change.
The Google Ads industry benchmarks resource can provide additional context, but your own history should remain the main reference for account decisions. A useful benchmark doesn't just label performance. It tells you what to investigate and what action the evidence supports.
The practical standard is disciplined comparison: same goal, same rules, comparable conditions, honest treatment of missing data, and a decision that follows from the evidence. That's how performance reporting becomes an operating system for PPC rather than a monthly scorecard.
Keywordme helps PPC teams compare keyword and campaign performance, review search-term data, apply exact, phrase, and broad match types, and build negative keyword lists without repetitive copy-and-paste work. Visit Keywordme to explore a seven-day free trial and make your next Google Ads comparison faster to analyse and easier to act on.
.svg)