
7 Ad with Statistics Examples That Convert
7 Ad with Statistics Examples That Convert


Adding a percentage to an ad doesn't automatically make it persuasive. A number earns attention only when it answers a buyer's concern, has a defensible source, and appears beside the right promise. An ad with statistics should connect evidence to intent, not use data as decoration.
The seven examples below examine conversion results, customer scale, time savings, cost and return, industry comparisons, customer success, and feature adoption. For each, the useful questions are practical: Where does the statistic belong? What context makes it credible? Which keyword intent does it serve? How should the visual treatment support it? What should the reader do next?
Treat every supplied brand, customer, and performance claim as unverified until the underlying records support it. That includes testimonials, logos, percentages, counts, and claims about savings. Good data can also improve the user experience when it helps people understand a choice, as discussed in this guide to improving UX with real data. Keywordme is relevant here as an example of connecting keyword and search-term data with PPC messaging, not as a substitute for evidence.
1. Conversion Rate Statistics in Ad Copy
Conversion statistics address the question behind many clicks: will this work for someone like me? A claim about completed actions can make an ad more concrete than a broad promise about quality, but only when the advertiser defines the action, audience, timeframe, and denominator.
For example, “See a higher conversion rate after optimizing search terms” is a claim about an outcome, but it isn't yet a publishable statistic. A defensible version would identify the measured event and the population behind it, such as “X% of qualified trial users completed setup within the stated period,” provided the advertiser can document X and explain how users were selected.
Placement changes the job of the number
A headline gives the statistic immediate visibility, while a description can explain what it measures. Google responsive search ads allow headlines of up to 30 characters and descriptions of up to 90 characters, with separate path fields of up to 15 characters. Google also says characters in double-width languages such as Korean, Japanese, and Chinese count as two characters. That makes concise, context-rich wording essential when the number competes with the benefit and keyword.
Keywordme users can connect conversion-focused search terms with ad variants, then review whether the traffic produces the stated action. The process fits with broader conversion rate optimization best practices.
Proof standard: Never turn an account metric into a customer outcome unless the data measures customers and the outcome you claim.
Use the statistic to reduce uncertainty, then give the reader a clear next step, such as viewing the method, checking eligibility, or starting a relevant workflow. A tool such as the ShortGenius AI ad generator may help produce variants, but it can't validate the underlying figure.

2. Customer Count and User Base Statistics
A user count works as a trust signal because it gives buyers a sense of adoption. “Join more users” is vague. “Join X customers in your industry” is more useful, but only if the count has a clear definition and an audit trail.
The examples often used in advertising include Gmail's “1.8 billion users worldwide,” Dropbox's “Over 700 million registered users,” Mailchimp's “Used by 12 million businesses,” and Zoom's reference to hosting millions of meetings daily. These are not interchangeable measures. A registered user isn't necessarily an active user, a business account isn't necessarily a paying customer, and meetings hosted don't equal unique organizations.
Scale must match the searcher's concern
A broad customer figure suits a brand-building ad. A comparison query, such as someone looking for a reliable advertising or CRM tool, may respond better to a segment-specific count, provided that segment can be verified. Keywordme can help identify search themes associated with comparison and hesitation, but the ad still needs to distinguish customers, accounts, users, active users, and transactions.
Avoid adding growth claims unless the starting point, ending point, and period are documented. Likewise, don't imply that a large user base proves superior performance. It proves reach or adoption under a stated definition, not that every customer achieved the same result.
A useful ad structure is:
- Count: State what is being counted.
- Context: Identify the relevant market, segment, or product.
- Action: Invite the reader to compare features, see the evidence, or try the product.
The visual should make the count easy to read without turning it into a giant unsupported badge. If the number is central to the promise, link the landing page to methodology, eligibility, or an updated customer record. Auditable precision beats impressive ambiguity.
3. Time-Saving Statistics in PPC Ads
Time claims appeal to a direct business pain: repetitive work delays decisions and consumes attention. “Save time” has little force by itself. A quantified claim becomes more meaningful when it identifies the task, the baseline, and the period, such as per campaign, per week, or per reporting cycle.
The examples in this category include Zapier's “Automate 100+ hours of manual work annually,” Calendly's “Save 40% of scheduling time,” Grammarly's “Cut editing time in half with AI assistance,” and Keywordme's “Optimize 10X faster with automated keyword management.” These figures should not be copied into an ad without records showing how the advertiser calculated them. The examples demonstrate formats, not permission to reuse claims.
Speed needs a baseline
A claim that a process is faster than another process requires a defined comparison. Is the baseline manual formatting, an existing tool, or a previous workflow? Does the result apply to new users, experienced operators, a particular account size, or a specific task?
Keywordme's relevance comes from the kinds of PPC work it is designed to streamline, including negative keyword handling, match-type assignment, bulk operations, and campaign expansion based on search-term data. Searchers using terms such as “faster keyword research” or “automate Google Ads” may already be signalling that speed matters. The ad should connect the statistic to one task rather than imply that every campaign activity takes the same amount of time. The Google Ads time-saving tools guide provides a relevant destination for that problem.
A time statistic persuades best when the reader can recognize the task before noticing the number.
Use a visual of the workflow, not just a stopwatch. Show what the user avoids, what the tool completes, and what remains under human review. Then test one variable at a time, perhaps the unit of time in one variant and the task description in another. If the evidence comes from customer research, retain the study design and participant definition. If it comes from internal workflow timing, label it accordingly.

4. Cost Reduction and ROI Statistics
Cost and return claims speak to budget owners, but they also create the highest expectation. A phrase such as “reduce advertising costs” can mean lower spend, lower cost per acquisition, less wasted spend, or improved efficiency at the same volume. Those outcomes aren't equivalent.
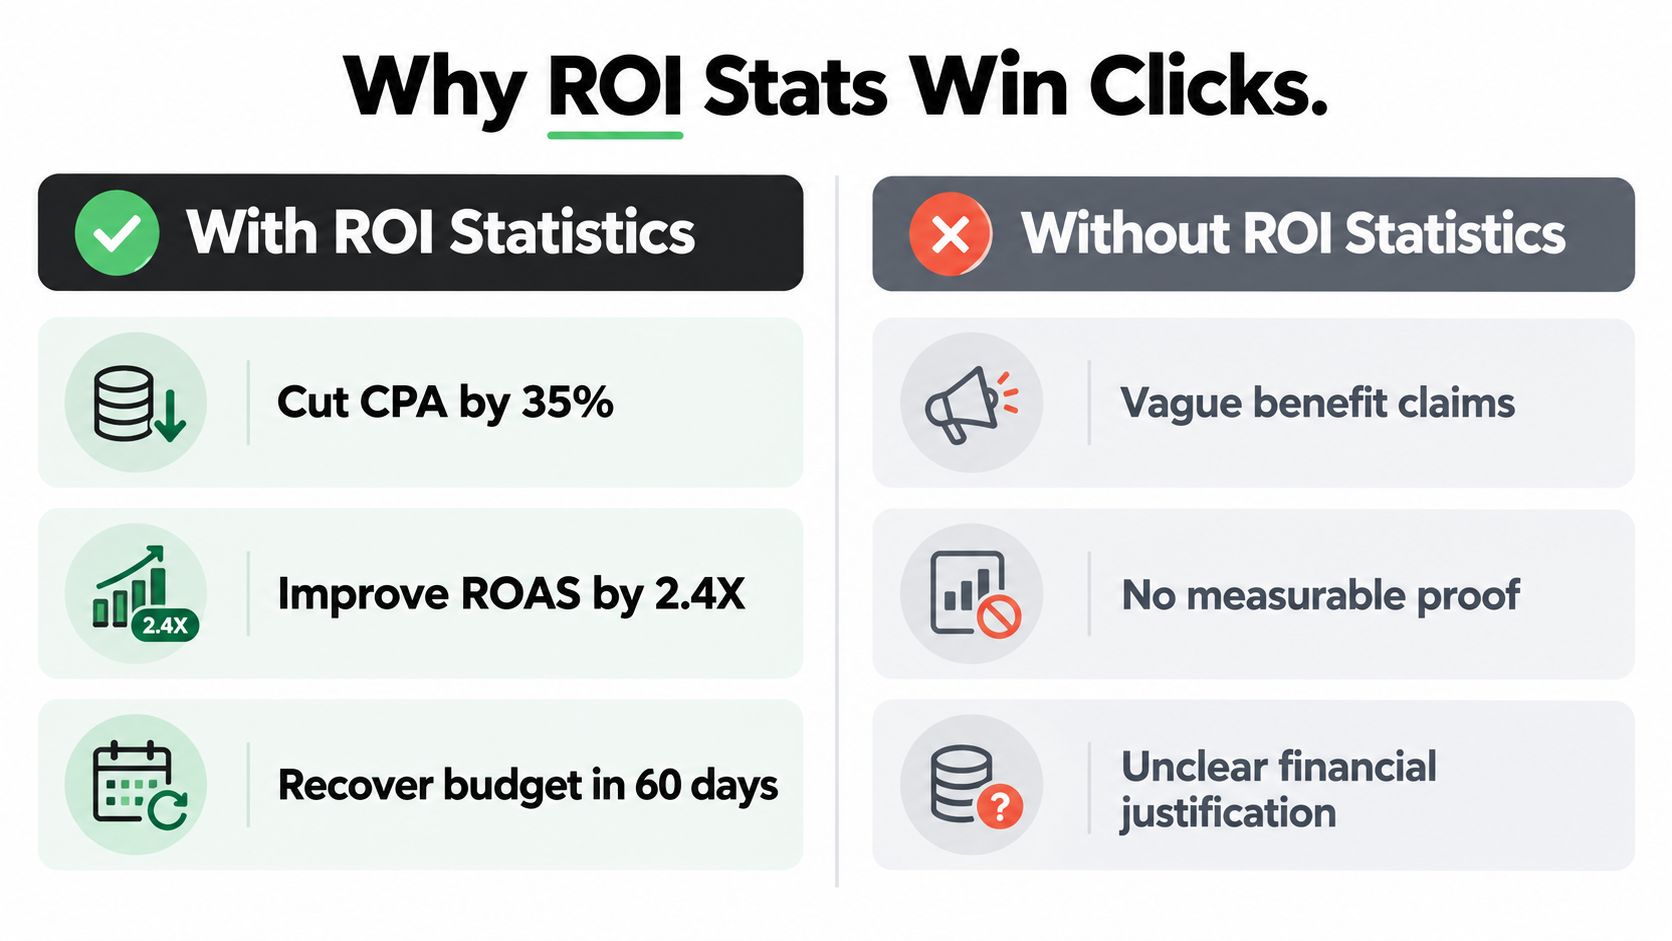
The planning examples include Keywordme's “Cut wasted ad spend by up to 40%,” SE Ranking's “Reduce SEO costs by 60% with automation,” Unbounce's “Improve ROAS by average of 2.6X,” and Demandbase's “Reduce sales cycle by 23%.” Each would require supporting evidence, a defined population, a timeframe, and conditions. A maximum claim, an average claim, and a typical result carry different meanings, so the wording must preserve that distinction.
Define the financial metric before the benefit
ROAS depends on the revenue and advertising-cost definitions used in the calculation. CPA depends on the conversion event. “Savings” depends on the counterfactual, meaning what the advertiser would have spent or achieved without the intervention. An ad that omits those details may attract clicks while creating distrust on the landing page.
Keywordme's stated product relevance is strongest when the message focuses on search-term cleanup and negative keyword management. Google Ads documentation explains that negative keywords exclude irrelevant search terms, and advertisers can add them at the ad group, campaign, or shared-list level. Google also notes that negative keywords handle casing and misspellings automatically, while synonyms and singular or plural variants may require separate exclusions. See the Google Ads negative keyword documentation for the platform rules.
Build separate variants for CPA, ROAS, and wasted spend only when each metric has its own evidence. Explain whether the claim applies weekly, monthly, or annually. A calculator, account snapshot, or methodology note can support the next action better than a dramatic graphic.
5. Benchmark and Industry Comparison Statistics
Comparison claims make the reader ask whether their current process is good enough. That question can produce strong commercial intent, especially in searches for the best tool, a leading platform, or an alternative to a familiar workflow. But “better than average” is not evidence until the advertiser identifies the benchmark.
Common examples include Salesforce positioning leaders in its category as users, HubSpot describing performance above industry benchmarks, Adobe associating top performers with Creative Cloud, and Keywordme's example claim about beating industry keyword optimization speeds. These examples show how comparison language works, but the numbers and implied relationships must be verified before publication.
The comparison needs a fair reference point
A benchmark should identify the population, metric, period, and method. Comparing automation speed with manual work may be reasonable if the tasks are equivalent. Comparing one company's selected customers with an entire industry may not be. A competitor comparison also requires current, comparable information and careful wording.
Keywordme can support research around terms such as “best Google Ads tool” and “Google Ads industry benchmarks,” while the Google Ads industry benchmarks article offers a relevant internal destination. The ad itself should make the comparison legible to the searcher. If the benchmark concerns query cleanup, don't let the creative imply a broader claim about campaign profitability.
Fair comparison rule: Name the metric and reference group before you name the advantage.
Visual treatment matters. A side-by-side chart can clarify a real baseline, but a winner badge can overstate a narrow result. Include implementation effort and relevant conditions where they materially affect the comparison. Test whether searchers respond to “versus manual work,” “versus average,” or a specific use case, but keep the underlying evidence unchanged.
6. Customer Success and Testimonial Statistics
Customer success statistics combine measurable experience with emotional reassurance. Ratings, satisfaction figures, retention, and review counts can help a hesitant searcher, but each measures a different part of the relationship.
The examples include G2's “4.8/5 stars from 5,000+ verified reviews,” Trustpilot's “Rated 4.7/5 by customers,” Keywordme's “96% of users report improved campaign efficiency,” and Slack's reference to use by 92% of Fortune 100 companies. These figures must remain tied to their original definitions. A rating isn't the same as satisfaction, company adoption isn't the same as individual usage, and self-reported efficiency isn't the same as independently measured performance.
Pair the number with a real voice
A statistic becomes more credible when the landing page explains who responded, when the response was collected, and what question people answered. If an ad includes a testimonial, obtain permission and preserve the customer's meaning. Company names and logos also require permission, especially when the creative implies endorsement.
Search terms containing “reviews,” “ratings,” and “trusted” signal a different mindset from searches focused on a feature. Keywordme can help organize that intent, but the ad should avoid presenting a review score as proof that the product suits every buyer.
Use one claim per variant. For example, test a satisfaction measure against a review rating, then compare the resulting qualified traffic and post-click behavior. Don't combine several trust signals into a crowded headline that leaves no room for context.
A practical evidence record should retain:
- Question wording: Store the exact satisfaction or efficiency question.
- Respondent definition: Record whether responses came from active customers, trial users, or another group.
- Collection period: Keep the date range and update process visible.
- Permission status: Document approval for names, quotes, and logos.
The ad's next action should let the reader inspect the evidence, read reviews, or see the customer story. Trust grows when the path after the click supports the number.
7. Feature Adoption and Usage Statistics
Feature adoption figures answer a practical objection: will customers use the capability they're buying? A product can have an impressive feature list, yet an adoption statistic may show whether users reach a meaningful workflow.
The examples include Keywordme's “87% of users automate negative keyword management,” Asana's reference to teams using custom workflows, Mixpanel's customer event-tracking example, and Figma's claim about teams collaborating on designs daily. These figures require product analytics and a clear definition of activation. A user who opens a feature once isn't necessarily an active adopter, and adoption doesn't automatically prove business value.
Connect usage to a job
The strongest version links the feature to the searcher's use case. Someone searching for negative keyword automation may care about finding irrelevant queries, applying exclusions, or managing lists at scale. Google says search-term tools help advertisers identify underperforming queries and add irrelevant terms as negatives, but its reporting only includes queries that meet minimum thresholds. That means visible data is useful but incomplete, as explained in Google's search terms reporting guidance.
This limitation changes the ad message. Don't imply that a visible query report contains every source of waste. A more careful claim describes the workflow the product supports and explains what the user can review.
Adoption is evidence that users reach a feature. It isn't evidence that the feature produced a particular return unless the measurement connects those events.
Segment adoption where user behavior differs materially by account type, industry, or workflow. Pair a feature rate with a documented benefit only when both measures come from the same defined population. Keep the visual focused on the feature path, and place the claim beside a demonstration or product view.
For broader campaigns, remember that keyword targeting is becoming less central as automation and signal-based systems expand. Search-term optimization still matters as a waste-control and structural-hygiene function, particularly when reach grows faster than manual review. Keywordme can help teams manage that operational layer, but the ad should state exactly what the feature does.
7-Point Ad Statistics Comparison
| Statistic Type | Implementation Complexity 🔄 | Resource Requirements ⚡ | Expected Outcomes 📊 | Ideal Use Cases 💡 | Key Advantages ⭐ |
|---|---|---|---|---|---|
| Conversion Rate Statistics in Ad Copy | Medium, requires accurate conversion tracking and periodic verification | Low–Medium, analytics access and A/B testing | High, boosts CTR and perceived credibility 📊 | Performance-driven ads, conversion-focused campaigns | Builds trust quickly; strong social proof |
| Customer Count & User Base Statistics | Low, aggregate user numbers but needs auditability 🔄 | Low, basic reporting and verification | High, creates bandwagon effect and market leadership 📊 | Established brands, competitive horizontal markets | Signals scale and trust; memorable claim |
| Time-Saving Statistics in PPC Ads | Medium, measure time savings reliably across cohorts 🔄 | Medium, user studies / product telemetry | High, drives urgency and high-intent clicks 📊 | Automation tools, productivity B2B, time-constrained buyers | Appeals to busy decision-makers; measurable benefit ⚡ |
| Cost Reduction & ROI Statistics | High, requires robust methodology and clear attribution 🔄 | High, financial analysis, case studies, third-party validation | Very High, strong conversion among budget-conscious buyers 📊 | CFOs, procurement, ROI-focused marketing campaigns | Provides clear financial justification; measurable ROI ⭐ |
| Benchmark & Industry Comparison Statistics | High, needs authoritative benchmarks and recent data 🔄 | High, market reports, third‑party sources | High, strengthens competitive positioning and urgency 📊 | Competitive research, enterprise selection processes | Differentiates vs. peers when substantiated; persuasive to performance-oriented buyers |
| Customer Success & Testimonial Statistics | Medium, systematic collection and verification of reviews 🔄 | Medium, NPS/CSAT surveys and review platforms | High, combines emotional trust with quantitative proof 📊 | Review-driven purchase stages, risk-averse buyers | Emotional + logical persuasion; high credibility when verified ⭐ |
| Feature Adoption & Usage Statistics | Medium, requires in-app instrumentation and analytics 🔄 | Medium, product analytics and segmentation | Medium–High, shows product value realization and stickiness 📊 | Feature-rich products, onboarding and activation campaigns | Demonstrates real usage and lowers perceived complexity; supports upsell ⭐ |
Turn Proof Into a Claim You Can Defend
A reliable statistic starts with search intent. A person searching for a faster workflow may need a time measure, while a comparison shopper may need a benchmark or review signal. Match the evidence to the concern, then state the denominator, timeframe, population, and conversion or usage definition. Without those details, precision can create a false impression of certainty.
Use these templates as writing frameworks, not as facts to publish without evidence:
- Percentage: “X% of [defined group] achieved [defined outcome] during [period], measured by [method].”
- Count: “[X] [customers, active users, or verified reviewers] have [defined relationship] as of [date].”
- Time: “[Defined group] completed [specific task] in X [minutes, hours, or days] under [stated conditions].”
- ROI: “For [defined group], [metric] changed from [baseline] to [result] during [period], using [calculation].”
- Benchmark: “[Defined group] recorded [metric] compared with [named reference group] during [period].”
- Satisfaction: “X% of [respondents] gave [defined response] to [exact question] during [period].”
- Adoption: “X% of [defined users] activated or repeatedly used [feature] during [period].”
Test one variable at a time. If you change the statistic, headline, visual, and call to action together, you won't know what caused the result. Keep the underlying evidence, exclusions, sample definition, and calculation available for review. A reporting process can help teams track what changed, as this guide to content metrics illustrates in a broader measurement context.
Obtain permission for testimonials and logos. Avoid comparisons that hide material conditions, disclose limitations that could change the buyer's decision, and review Google Ads requirements alongside applicable advertising and consumer-protection rules. Search-term reports also have coverage limits, so recurring review and longer lookback windows are safer than treating one short report as a complete account picture.
Keywordme can connect real keyword and search-term performance data with PPC messaging, helping teams identify intent, organize negative keywords, apply match types, and manage campaign changes without relying on unsupported assumptions. For product context, visit Keywordme.
Use Keywordme to connect defensible ad statistics with the searches that trigger them, then build cleaner keyword and negative-keyword workflows around real account data. Visit Keywordme to explore the platform and start aligning PPC claims with buyer intent.
.svg)