Pay per click reporting: Unlock Cleaner PPC Insights & ROI
Pay per click reporting: Unlock Cleaner PPC Insights & ROI

Ditch the dense spreadsheets for a moment. Real pay-per-click reporting isn't just about data dumps; it's your campaign's mission control. It gives you a bird's-eye view of what’s actually working, what's just burning through your budget, and where your next big win is hiding. This is all about turning raw data into a clear, actionable story about your ad performance.
What Your PPC Reports Are Really Trying To Tell You

Let's be real—staring at endless rows of numbers can make your eyes glaze over. But great pay per click reporting is less about getting lost in the weeds and more about finding the narrative hidden in the data. It’s the skill that separates guessing from knowing, giving you the ammo you need to justify your marketing spend with hard data that actually makes sense.
Think of your reports as a direct line of communication from your audience. They tell you things like:
- What’s hitting the mark: Which ads, keywords, and landing pages are actually driving interest and action.
- Where the leaks are: Pinpointing those irrelevant search terms that are quietly draining your budget without bringing in any real results.
- Untapped potential: Uncovering unexpected search queries that reveal new customer needs or even whole new market segments you hadn't considered.
This is how you move beyond just tracking clicks and impressions. It’s about understanding the intent behind every interaction, squeezing more value out of every dollar you spend, and ultimately making smarter decisions that help you grow. To really get the hang of interpreting your results, check out this fantastic guide to the Pay Per Click Report.
Why A Solid Reporting Framework Is Non-Negotiable
Without a solid reporting framework, you're essentially flying blind. Sure, you might see some positive results here and there, but you won't know why they're happening or how to make them happen again. A structured approach is probably the single most important thing you can do to boost your return on investment (ROI).
The stakes are higher than ever. With global digital ad spending expected to rocket past $500 billion, and PPC campaigns taking a huge slice of that pie, getting your reporting right is crucial. On average, businesses earn $2 for every $1 spent on Google Ads, but that only happens if they're obsessively monitoring performance. This is how you turn raw stats into actionable wins that can slash wasted spend.
A great report doesn't just present data; it asks the right questions. It should immediately make you think, "Okay, so what do we do next based on this?"
Ultimately, mastering your reporting gives you control. It empowers you to stop just reacting to campaign performance and start proactively shaping it for much better outcomes.
Choosing KPIs That Actually Drive Growth
Before you even think about building a dashboard for your pay-per-click reporting, you need a solid blueprint. This isn’t about just grabbing every metric Google Ads throws at you; it’s about strategically picking the Key Performance Indicators (KPIs) that tell you if you're actually hitting your business goals.
Chasing vanity metrics like impressions or clicks feels productive, I get it. But those numbers don't pay the bills. Real growth comes from focusing on what truly matters: the figures that connect your ad spend directly to your bottom line.
Moving Past Vanity Metrics
It's so easy to get distracted by big, impressive-looking numbers. A campaign with 100,000 impressions sounds great on paper, right? But if none of those people click, or worse, none of them buy anything, those impressions are just digital noise.
To build a report that's actually useful, you have to shift your focus to the metrics that measure real outcomes.
- Cost Per Acquisition (CPA): This is the big one. It tells you exactly how much you're paying to get one new customer. It’s the ultimate reality check on whether your ad spend is efficient. We have a whole guide that dives deep into how to calculate Cost Per Acquisition if you want to get into the nitty-gritty.
- Return On Ad Spend (ROAS): For every single dollar you put into your ads, how many dollars are you getting back? A ROAS of 4:1 means you’re making $4 for every $1 you spend. This is non-negotiable for e-commerce or any business selling directly online.
- Conversion Rate: What percentage of people who click your ad actually do the thing you want them to do (buy a product, fill out a form)? A low conversion rate is a huge red flag, often pointing to a mismatch between your ad creative and your landing page experience.
These three KPIs are the bedrock of a report that drives real decisions. They change the conversation from "How many people saw our ad?" to "How much money did our ads make us?"
Aligning KPIs with Campaign Goals
Let's be honest, not all campaigns are built the same, so your KPIs shouldn't be either. The metrics you watch have to line up perfectly with what you're trying to achieve. Using a one-size-fits-all reporting template will just muddy the waters.
Think about it this way:
For Lead Generation Campaigns
The goal here is simple: get quality leads without breaking the bank.
- Primary KPI: Cost Per Lead (CPL) or CPA
- Secondary KPIs: Conversion Rate (form fills), Lead-to-Close Rate
For E-commerce Campaigns
This is all about the money. We're driving sales and maximizing profit.
- Primary KPI: Return On Ad Spend (ROAS)
- Secondary KPIs: Average Order Value (AOV), Conversion Rate (purchases), Customer Lifetime Value (CLV)
For Brand Awareness Campaigns
Here, the goal is a bit softer. You're just trying to get your name in front of as many relevant eyeballs as possible.
- Primary KPIs: Reach, Impressions, Video View Rate
- Secondary KPIs: Ad Recall Lift, Website Traffic, Branded Search Volume
When you tailor your KPIs to each campaign's specific job, your pay-per-click reporting stops being a data dump and becomes a precision tool for measuring what truly matters for that initiative.
As you think about which KPIs to focus on, it's worth exploring the finer points of setting and measuring Key Performance Indicators (KPIs) for marketing agencies to gain more perspective. Getting this first step right is the difference between a report that gets ignored and one that actively guides your team toward a healthier bottom line.
Build an Automated Reporting Dashboard That Works
Alright, enough with the theory. Let's get our hands dirty and build a powerful, automated pay-per-click reporting dashboard that actually does the heavy lifting for you. This is how you finally break up with tedious manual exports and that soul-crushing copy-paste routine.
The whole point is to create a dynamic report that basically runs itself. Using a free (and surprisingly robust) tool like Looker Studio (formerly Google Data Studio), you can build a central command center for all your PPC data. This isn't just about saving a few hours a week; it's about having real-time access to the numbers you need to make quick, informed decisions.
This simple flow shows you exactly how your big-picture revenue goals should cascade down to the specific KPIs you track.
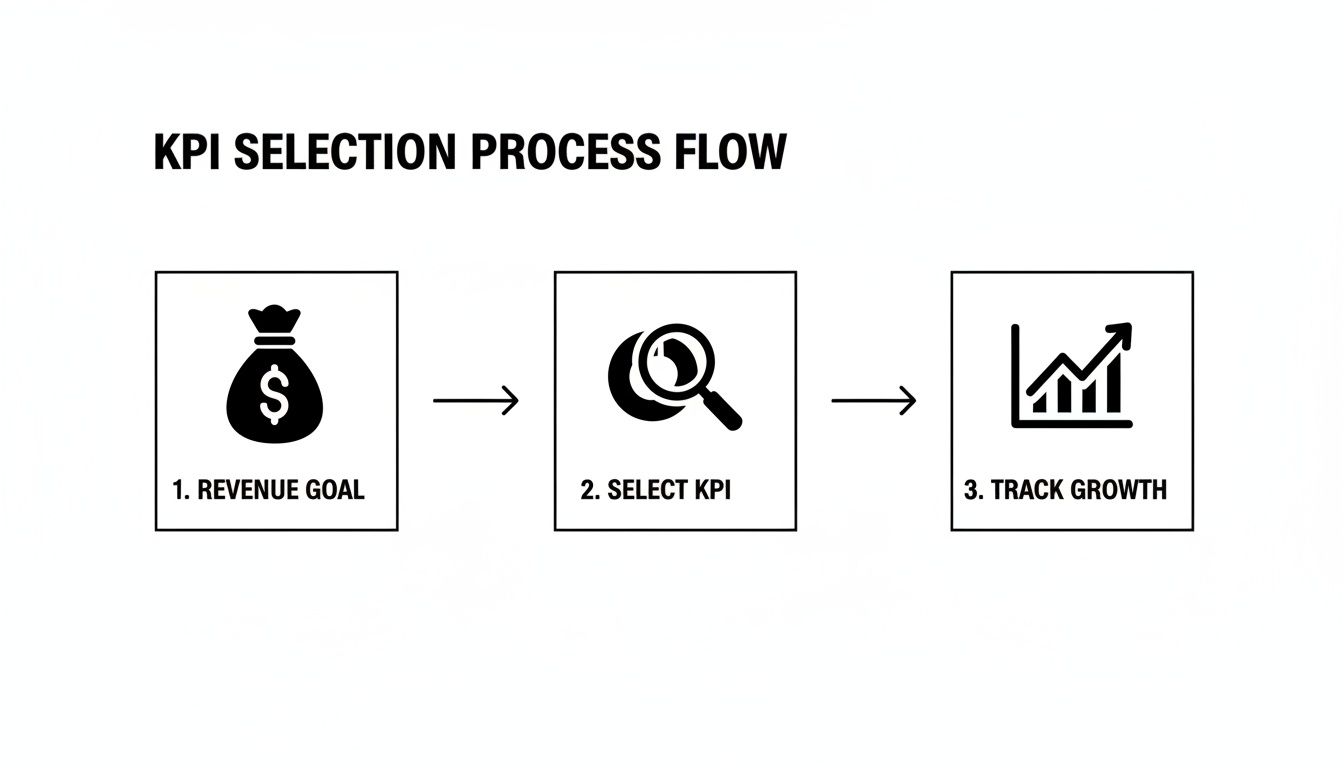
When you start with your financial targets, every single metric you add to that dashboard has a clear purpose: measuring and driving growth.
Connecting Your Data Sources
First things first, you need to get your data flowing into Looker Studio. Luckily, since it's a Google product, it plays very nicely with its siblings. The two main connections you'll be making are for Google Ads and Google Analytics 4 (GA4).
Hooking them up is pretty painless:
- Open Looker Studio and start a new blank report.
- It'll immediately ask you to add data. Search for and select the "Google Ads" connector.
- You'll have to authorize your account, then simply pick the specific ad account you want to report on.
- Do the exact same thing for the "Google Analytics" connector. This pulls in your GA4 data, giving you that crucial visibility into what users do after they click an ad.
This one-time setup is the bedrock of your whole automated system. Once connected, the data refreshes on its own (usually every 12 hours by default, but you can change that). No more downloading CSVs. Ever.
Structuring Your Dashboard for Clarity
A cluttered dashboard is just a prettier version of a 50-tab spreadsheet—completely useless. The trick is to structure it logically so it tells a performance story from top to bottom. Over the years, I've found a two-part structure works incredibly well.
The Executive Summary (Top Section)
Think of this as the "at-a-glance" view for clients, your boss, or even just for your own quick daily check-in. It needs to be clean, simple, and feature only the most critical, high-level KPIs.
- Scorecards: These are perfect for your big numbers: Total Spend, ROAS, CPA, and Total Conversions. They give you an instant health check on the account.
- Date Range Filter: This is non-negotiable. Stick it right at the top so anyone looking at the report can easily switch between "Last 7 Days," "This Month," or "This Quarter."
The Granular Deep Dive (Bottom Section)
Right below the summary is where you can geek out. This section is for diagnosing performance and hunting for those golden optimization opportunities.
- Time Series Charts: I always include a line graph plotting ROAS and Spend over time. It’s the fastest way to spot trends. Did ROAS suddenly tank right after you launched that new campaign? This chart will scream it at you.
- Tables: Use tables to slice and dice performance by campaign, ad group, or even specific keywords. Be sure to include metrics like Clicks, CTR, Conversions, and CPA for each line item.
This layout lets everyone from the CEO down to a junior PPC specialist get the exact level of detail they need without feeling overwhelmed. If you're feeling stuck, browsing through a few well-made pay per click reporting templates can be a fantastic way to get ideas for your own layout.
Your dashboard's job is to provide answers, not just data. If someone has to spend more than 30 seconds trying to figure out what a chart means, it needs to be simplified.
This kind of detailed reporting is what separates the pros from the amateurs. When businesses see an average $2 return for every $1 invested in Google Ads, you understand why getting this right is so important. With average search ad conversion rates at 4.4% and a 3.17% CTR, every click matters—especially when the average CPC is $2.69. That means for every 100 clicks, you're spending $269. Meticulous reporting is the only way to make sure that money is actually turning into revenue.
By putting in the effort upfront to build a solid, automated dashboard, you’re not just making a report. You’re building a strategic tool that will pay for itself over and over again in saved time and smarter, more profitable optimizations.
Turn Your Data Into Actionable Insights
A slick dashboard is nice, but let's be honest—a beautiful report is useless if you don't know what to do with the information inside it. This is where you graduate from just collecting data to actually using it to make more money.
Real pay per click reporting is all about interpretation. It’s about turning those charts and numbers into concrete optimization strategies that move the needle. You have to constantly ask "So what?" and "What's next?" for every metric you see. The data isn't the end goal; it's the raw material you use to build a better, more profitable campaign.
Decoding Common Campaign Scenarios
Let's walk through a few real-world situations you'll almost certainly run into. Knowing how to react is everything.
High Click-Through Rate (CTR) but Low Conversions
This is a classic. People are loving your ad—the headline is catchy, the copy is compelling—but when they hit your landing page, the magic just fizzles out.
- The Likely Suspect: Your landing page experience. There’s a major disconnect between what your ad promises and what the page actually delivers.
- Your Action Plan: Time for a hard look at that landing page. Does the headline match the ad copy perfectly? Is the call-to-action (CTA) clear and impossible to miss? How fast does the page load, especially on a phone? You might need to test new page layouts, simplify your contact form, or make your offer more obvious.
Cost Per Acquisition (CPA) is Slowly Creeping Up
You open your report and see your CPA has jumped from $25 last month to $40 this month. Don't panic.
- The Likely Suspects: This could be a couple of things. Maybe new competitors are driving up bid prices. Or it could be simple ad fatigue—your audience has seen your creative so many times it's become invisible.
- Your Action Plan: First, dive into your auction insights report. See if new players have entered the ring. If so, you might need to get smarter with your bidding strategy. Next, check your ad frequency. If it's high, it's definitely time to swap in some fresh ad creative.
A rising CPA isn't a failure; it's a signal. Your report is telling you that market conditions or audience sentiment has shifted, and you need to adapt.
This constant feedback loop is what makes great reporting so powerful. You're not just looking at what happened last month; you're getting a road map for what to do next week.
The Goldmine Hiding in Your Search Terms Report
If there’s one part of your pay per click reporting you absolutely cannot afford to ignore, it’s the search terms report. This isn't just a list of keywords; it’s the literal voice of your customer. It shows you the exact, unfiltered queries people are typing into Google moments before they click your ad.
This is where you close the loop between data and real-world results. Digging into this report lets you do two incredibly important things:
- Plug Budget Leaks: You will always find search terms that are completely irrelevant but are triggering your ads and wasting your money. Someone searching for "free graphic design software" who clicks your ad for a paid subscription service is a click you just paid for with zero chance of a return.
- Discover New Opportunities: You'll also find golden nuggets—high-intent search terms you never even thought to bid on. These are often the long-tail keywords that show someone is ready to buy right now.
For a deeper dive into making sense of this data, our guide to paid search analytics can help you connect the dots between raw clicks and actual customer behavior.
Automating Your Search Term Cleanup
Let’s be real: manually sifting through thousands of search terms is a nightmare. It’s tedious, takes forever, and is the kind of task where it's easy to make mistakes. This is exactly where you need a tool built for efficiency.
Think of it this way: instead of spending hours exporting data into a spreadsheet, a tool like the Keywordme Chrome plugin can streamline the entire process.
- Spotting Waste: Instantly see junk terms and add them to your negative keyword list with a single click.
- Expanding Winners: Identify a great, high-converting search term and immediately add it as a new exact or phrase match keyword to the right ad group.
This approach transforms search term analysis from a dreaded monthly chore into a quick, routine optimization task. It’s how you consistently refine your targeting, lower your CPA, and make sure your budget is only spent on the clicks that actually matter.
Pro-Level Reporting Tips to Level Up Your Game
Alright, so you’ve got your basic PPC reporting dashboard built and you know how to read it. That's a great start, but now it’s time to really dig in and add the kind of sophisticated layers that separate the true pros from the crowd.
These aren't just fancy bells and whistles. These are the techniques that will save you a ton of time, automate the boring stuff, and uncover those hidden-gem optimization opportunities that most people completely miss. Let's make your data start working for you.
Keep Stakeholders in the Loop, Automatically
One of the biggest time-sucks for any PPC manager is rounding up performance stats and emailing them out. You can get all those hours back by setting up automated email summaries right from your Looker Studio dashboard. It's a total game-changer for keeping clients or your boss in the loop without you lifting a finger.
Think of it as your personal reporting assistant. You can literally schedule a PDF snapshot of your dashboard to land in key stakeholders' inboxes every Monday morning like clockwork.
Automating high-level summaries puts you in control of the conversation. You're proactively showing everyone the most important KPIs on a regular basis, which goes a long way in managing expectations and proving the value you're driving.
This one simple automation cuts down on all those "How are things going?" emails and guarantees everyone is looking at the same numbers in the same format.
Slice and Dice Your Data with Segmentation
Looking at your overall CPA or ROAS is fine for a 30,000-foot view, but the real insights come from breaking that data down. This is how you go from making broad guesses to surgical-strike optimizations. Your dashboard needs to make it easy to slice performance by these critical dimensions:
- Device Performance: Are mobile users converting at a lower rate but for way cheaper? Maybe your mobile landing page needs a tune-up, or it might be time to get more aggressive with mobile bids.
- Geographic Breakdowns: Is your CPA in New York double what it is in Texas? That’s a huge red flag. It could mean you need location-specific ad copy or even different offers for different regions.
- Time-of-Day Analysis: What if you find out 80% of your conversions happen between 9 AM and 5 PM on weekdays? Then why are you burning cash at 2 AM on a Sunday? Setting up a dayparting schedule is one of the quickest wins you can find.
Segmentation transforms your report from a static picture into an interactive diagnostic tool. It’s how you spot those small pockets of wasted spend that, once you fix them, add up to serious budget savings and better results.
Create Your Own Metrics with Calculated Fields
Sometimes, the default metrics just don't tell the full story. What if you need to track a KPI that’s totally unique to your business, like "Cost per Qualified Lead" or "ROAS (excluding brand campaigns)"? This is where calculated fields in Looker Studio become your absolute best friend.
A calculated field lets you whip up your own metrics by applying simple formulas to your data. For instance, if your sales team tells you only 50% of your form fills are actually qualified, you can create a new metric called "Qualified Leads" with the formula: Conversions * 0.5.
From there, you can create another field for "Cost per Qualified Lead" (Cost / Qualified Leads). Now you're looking at a number that more accurately reflects the campaign's true impact on the business. It’s a powerful way to tailor your pay per click reporting to the numbers your CEO actually cares about.
Build the Full Picture with Data Blending
Your Google Ads campaigns aren't an island. To get a truly complete picture of performance, you need to pull in data from your other paid channels—think Microsoft Ads, Meta Ads, or LinkedIn. This is exactly what Looker Studio’s data blending feature was made for.
Data blending lets you create charts and tables that pull from multiple data sources at once. Imagine a single scorecard showing your total ad spend across Google, Microsoft, and Facebook. Or a unified table comparing the CPA and conversion volume from each platform, side-by-side.
This gives you a single source of truth for all your paid media. It helps you make much smarter budget decisions by clearly showing which channels are pulling their weight. This holistic view is the final piece of the puzzle in creating a genuinely intelligent reporting system that fuels strategic growth.
Common Questions About PPC Reporting
Even with the slickest dashboards, you're going to have questions. Dialing in your pay-per-click reporting is a marathon, not a sprint. So, let's go over some of the most common things that pop up when you're in the trenches.
How Often Should I Be Looking at My PPC Reports?
Ah, the classic question. The real answer is that it depends on how much you're spending and how active your campaigns are. But if you're looking for a solid routine, this is what I've seen work best for years.
- Daily Gut Check (5 minutes): This isn't about deep analysis. It's a quick peek to make sure nothing is on fire. Is the spend normal? Are conversions coming in? You're just making sure a broken landing page or a glitch hasn't tanked your entire account overnight.
- Weekly Deep Dive (1-2 hours): This is your real "work" session. Block out this time to dig into search term reports, see which ad groups are killing it (and which aren't), and make your strategic bid adjustments. This is where you do your actual optimizing.
- Monthly & Quarterly Big Picture: Zoom out. Use these reports to spot the bigger trends. How are we tracking against our core KPIs? What can we learn from the last 30 or 90 days to inform our strategy and budget for the next period?
This rhythm keeps you on top of things without getting bogged down in the daily data firehose, while still carving out time for meaningful strategic planning.
If I Could Only Track One Metric, What Should It Be?
If you twisted my arm and made me pick just one, it would have to be a metric that directly ties to the money. Think Return On Ad Spend (ROAS) or Cost Per Acquisition (CPA).
Metrics like click-through rate (CTR) and cost-per-click (CPC) are crucial for diagnosing why performance is what it is. But ROAS and CPA tell you if all that work is actually profitable for the business.
Think of it like this: CTR and CPC are the vital signs the doctor checks—pulse, blood pressure. ROAS and CPA are the final diagnosis: is the patient healthy or not?
For an e-commerce store, ROAS is everything. For a B2B company chasing leads, CPA is the north star. Your most important metric should always reflect the campaign's ultimate financial goal.
Can't I Just Do All My Reporting Inside Google Ads?
You could, but you'll outgrow it fast. The Google Ads interface is great for what it is: a tool for managing campaigns day-to-day. But when it comes to presenting performance to a boss, a client, or anyone who isn't a PPC nerd, it falls short.
Tools like Looker Studio are built for storytelling with data. You can design dashboards that actually make sense to a non-expert. More importantly, you can pull in data from other places, like Google Analytics 4, to show the full picture—from first click to final conversion. That's something you just can't do inside the Google Ads platform alone.
What's the Best Way to Report on Search Terms?
The most effective approach isn't just about reporting; it's about making it an active cleanup routine. Don't just look at the data—do something with it. I make it a habit to regularly export my search term data and immediately do two things:
- Hunt down irrelevant search terms that are just burning cash and add them as negative keywords.
- Spot new, high-intent queries that are actually converting and add them as new exact match keywords.
This constant process of pruning the bad and nurturing the good is the secret sauce to a hyper-efficient campaign. It ensures your budget is always flowing away from waste and toward what works.
Turning messy search term data into clean, actionable insights is exactly why we built Keywordme. Instead of getting lost in spreadsheets for hours, our Chrome plugin helps you slash junk terms and add winning keywords in a fraction of the time. Stop leaking budget and start optimizing smarter. Try Keywordme free for seven days and see the difference it makes.