Master auction insights in adwords to boost your ROI
Master auction insights in adwords to boost your ROI

Ever feel like you’re flying blind with your Google Ads bids? The Auction Insights report is the tool that flips on the lights. Think of it as your competitive radar in a packed marketplace, showing you exactly who you’re up against and how you truly stack up. It’s all about turning confusing auction data into smart, actionable strategies.
Your Competitive Edge in PPC Starts Here

Running Google Ads campaigns can often feel like you're shouting into a void. You dial in your bids, craft killer ad copy, and hit launch, but one massive question always lingers: How am I actually doing against my competitors? That’s the exact problem the Auction Insights report was built to solve.
It pulls back the curtain on the whole Google Ads auction process. Instead of just staring at your own performance data in a vacuum, you get a direct side-by-side comparison with the other advertisers fighting for the same keywords. For anyone serious about squeezing every drop of value from their ad spend, this is non-negotiable.
Why This Report Is a Must-Use
As the digital ad space gets more crowded, this report's value only grows. With businesses pulling in an average of $2 in profit for every $1 spent on Google Ads, the pressure is on to optimize every single part of your campaigns. That impressive 2:1 ROI isn't an accident; it's the result of staying ahead of the competition, and this report is how you do it.
Getting a handle on this tool isn't just about snooping on rivals; it's about making smarter, more strategic decisions on the fly. You can see:
- Who your real digital competitors are (and they're not always who you think!).
- How often your ads are showing up compared to theirs.
- Which competitors are consistently bidding more aggressively than you.
- Where you might be missing out on valuable impressions.
This is the kind of intel that lets you quickly see which domains are your main competition and how often you're both showing up in the same search results. Having that visibility is the critical first step to building a bidding strategy that actually works.
Building Your Foundational Knowledge
To really get an edge in PPC, you first need to get the fundamentals of paid search advertising and understand how those keyword auctions work. This report gives you the raw data you need to put all that theory into practice.
By diving into this data, you shift from just reacting to what happens to proactively shaping your strategy. It lets you stop guessing and start making data-backed decisions that directly impact your bottom line.
In this guide, we’re going to break down this powerful feature, piece by piece. We'll walk through what each metric means and, more importantly, how to turn those numbers into real-world campaign improvements. To get a head start, you can check out our deep dive on how to perform a complete Google Ads competitor analysis. Let's get into the practical stuff that actually drives growth.
Finding and Navigating Your Auction Insights Report
So, where is this goldmine of competitor data hiding? The Auction Insights report isn't something you'll stumble upon on your main dashboard; you've gotta know where to look. It’s tucked away inside your Google Ads account, but getting to it is actually pretty simple once you know the drill.
Think of it this way: your main campaign view shows you how your players are performing. Auction Insights is like getting the all-22 film from the broadcast booth, showing you every player on the field—including all your rivals. You can pull this data for your entire campaign, a single ad group, or even just one crucial keyword, letting you zoom in on the action.
How to Pull Up the Report
The key here is first deciding what you want to analyze. Are you curious about the competition for an entire campaign, or do you need to see who’s fighting you for one specific, high-value keyword? Your starting point depends on that question.
Here's the quick play-by-play to get there:
- Sign in to your Google Ads account.
- In the left-hand navigation menu, choose whether you want to look at Campaigns, Ad groups, or Keywords.
- Check the box next to the specific campaign, ad group, or keyword(s) you want to investigate.
- A blue bar will pop up above the data table. Just click Auction insights.
And that's it. Google will instantly generate the report, giving you a list of competitor domains and a breakdown of how you stack up against them for your chosen date range.
Understanding the Different Report Levels
Choosing the right level is everything. Each one tells a different story.
- Campaign Level: This is your 30,000-foot view. It's perfect for identifying your main competitors across a broad set of keywords. It answers the big question: "Who are our primary rivals overall?"
- Ad Group Level: This gets more focused. It helps you see who's bidding hard on specific products or service categories. You might spot a niche competitor here that you'd totally miss at the campaign level.
- Keyword Level: This is as granular as it gets. Looking at a single keyword shows you exactly who you're battling for that prime digital real estate. This is absolutely essential for making smart bid adjustments on your money-making terms.
Think of these levels as the zoom function on a camera. You can get a wide landscape shot at the campaign level or zoom all the way in for a close-up on a specific keyword. This flexibility is what makes Auction Insights so powerful for building a PPC strategy that can adapt to different competitive threats.
What The 6 Core Auction Insights Metrics Really Tell You
Alright, you've found the report. Now for the fun part—making sense of the data. The Auction Insights report revolves around six key metrics. Don't just look at them as numbers on a screen; think of them as clues in a detective story about your competitive landscape.
Each metric is a piece of the puzzle. When you put them all together, you get a surprisingly clear picture of who you're really up against, how aggressively they're bidding, and where you're either leading the pack or eating their dust. Let's dive in and see what these numbers actually mean for your strategy.
This diagram shows how you can pull this data at different levels of your account—from a high-level campaign view right down to a specific keyword battle.
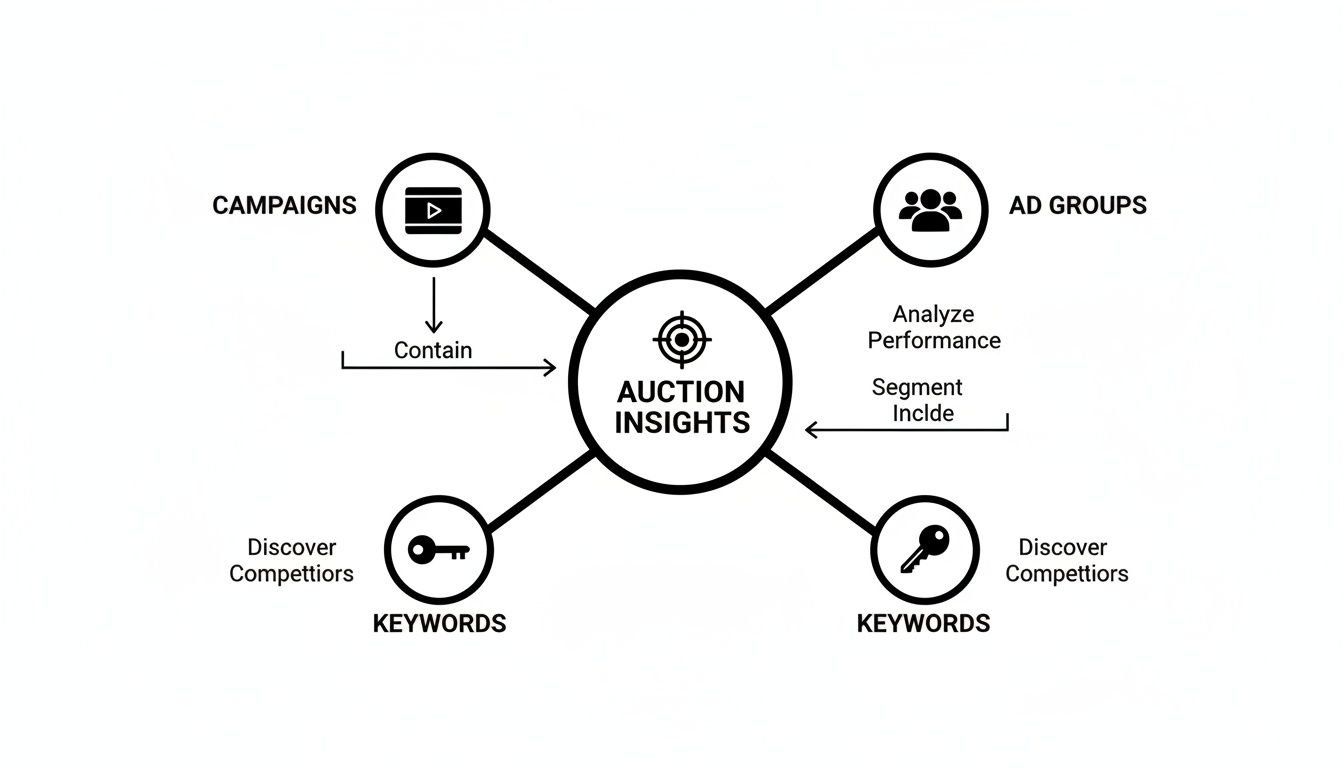
This flexibility is awesome. You can spot broad competitive trends at the campaign level or zoom in on a single keyword to see exactly who you're fighting for that top spot.
Your Guide To The 6 Auction Insights Metrics
To get started, it helps to have a quick cheat sheet for what each metric means and why it matters. Think of this table as your Rosetta Stone for decoding the report.
Now that you have the big picture, let's unpack each of these metrics one by one to see how they work together.
Impression Share
This is the big one and usually the best place to start. Impression Share is your market share within the Google Ads auction. It tells you what percentage of available impressions you actually captured.
If your impression share is 30%, that means for every 10 searches where your ad was eligible to show, it only appeared 3 times. The other 70% represents missed opportunities. Those impressions went to someone else, likely because your budget ran out for the day or your Ad Rank wasn't high enough to enter the auction. For a deeper dive, our guide on what Impression Share is is a great resource.
Overlap Rate
Next up, Overlap Rate. This one is simple: it shows how often another advertiser’s ad appeared in the very same auction as yours. A high overlap rate means you're constantly going head-to-head with that competitor.
So, if Competitor A has an overlap rate of 60%, it means that 6 out of 10 times your ad appeared, theirs was right there on the page, too. This is your cue to spy on their ad copy and landing pages. What are they saying that you aren't?
Position Above Rate
When your ad and a competitor's ad both show up, who gets the better spot? That’s exactly what Position Above Rate tells you. It’s the percentage of time that competitor’s ad was shown in a higher position than yours.
Seeing a high number here should set off some alarm bells. It's a direct signal that a competitor is beating you, either by bidding more aggressively or by having a better Quality Score. It’s time to figure out why you’re being pushed down the page.
Top of Page & Absolute Top of Page Rate
These two metrics sound similar, but they tell a very different story about your ad’s visibility.
- Top of Page Rate: This is how often your ad appeared anywhere above the organic results. Being "at the top" is good for visibility.
- Absolute Top of Page Rate: This is the money spot. It’s how often your ad appeared in the very first position on the entire page.
Comparing these two is incredibly insightful. A high Top of Page Rate but a low Absolute Top of Page Rate tells you that you're in the game, but you’re consistently losing that prime #1 position to a rival.
Outranking Share
Last but not least, we have Outranking Share. This is your ultimate competitive scorecard. It measures how often your ad ranked higher than a competitor's ad, plus the times your ad showed when theirs didn't show at all.
Essentially, it’s your win rate against a specific opponent. If your Outranking Share against a key competitor is 75%, it means you're winning that direct matchup three-quarters of the time. This is the number you want to see trending up as you fine-tune your campaigns.
Turning Insights Into Winning Campaign Actions

Alright, so you’ve got the numbers. Now for the fun part: turning that data into real-world wins for your Google Ads campaigns. Knowing the metrics is one thing, but the real magic comes from using them to make smarter, faster decisions.
Think of your auction insights in Adwords report like a diagnostic tool from your doctor. They don't just hand you a lab report and say, "Looks like your numbers are… numbers." They give you a plan. That's exactly what we're going to do here—create a playbook to win more auctions.
Every pattern you spot in this report is a breadcrumb trail leading to a specific strategic move. By learning to read these signals, you can stop guessing and start building a proactive, data-backed strategy that keeps you ahead of the pack.
Adjusting Your Bidding Strategy
Your bidding strategy is the most obvious place to start. It’s the biggest lever you can pull in response to what you see in the auction insights.
Let’s say a key competitor consistently has a high Position Above Rate. That’s a loud-and-clear signal that they’re either bidding more aggressively than you or they have a better Ad Rank. This forces a choice: do you raise your bids to fight for that top spot, or is the cost-per-click getting too steep to be profitable? Sometimes, the smartest play is to back off a hyper-competitive keyword and put that budget toward long-tail terms you can actually own.
On the flip side, if your Outranking Share is sky-high against your main rivals, you might actually be overbidding. You could try carefully lowering your bids to see if you can keep your position while bringing down your cost-per-acquisition (CPA). It's all about finding that sweet spot where you get maximum visibility without burning through your cash.
Scenario-Based Action Plans
Let's get tactical. Your response needs to fit the specific situation. Here are a few common scenarios you'll run into and what to do about them.
Scenario 1: High Overlap Rate, Low Position Above Rate
- What it means: You and a competitor are always showing up to the same party, but you're consistently getting the better seat.
- Action: Defend your turf. Go look at their ad copy and landing pages. What are they offering? Is there an angle you're missing? Beef up your own ad copy and extensions to make sure your value prop is undeniable.
Scenario 2: A New Competitor Appears with High Impression Share
- What it means: Someone new just walked into the auction with a big bag of cash.
- Action: Don't freak out and start a bidding war. Watch them for a bit. Check their ads and offers. They could be targeting a slightly different audience or just burning through a short-term promotional budget. Stick to your own game plan and focus on profitability first.
Scenario 3: High Top of Page Rate, Low Absolute Top of Page Rate
- What it means: You’re on the first page, but you're not in that coveted #1 spot. You're getting beat for the best real estate.
- Action: This is a classic sign you need to work on your Ad Rank. Instead of just throwing more money at bids, focus on things like improving click-through rates and beefing up your landing page experience. A better Quality Score can vault you into that top position without you having to spend a dime more per click.
Refining Keywords and Ad Copy
This report is an absolute goldmine for new ad copy ideas. If you see a competitor creeping up on you, open an incognito window and search for your top keywords. What are they saying in their headlines? What customer pain points are they hitting?
Use that intel to sharpen your own message. The goal isn't to copy them—it's to find a way to stand out. If everyone is screaming "low prices," maybe you can win by talking about "premium quality" or "24/7 support." The report tells you what conversation your competitors are having with your customers, giving you a perfect opportunity to say something better.
The insights you gather directly inform your ad creative. When you see what your rivals are doing, you can zig where they zag, creating a unique selling proposition that captures attention and clicks.
Now more than ever, data from the auction insights in Adwords report is a game-changer. In competitive industries like retail—which accounts for a massive 27% of total Google Ads spend—this report gives you a real-world look at how you stack up. With cost-per-click inflation finally slowing down, making these kinds of strategic tweaks is what separates the winners from the losers.
And if your team uses tools like keywordme, these insights get even more powerful. You can spot the keywords your top competitors are bidding on and instantly expand your own campaigns to cover them, all while automating the painful work of setting up match types and negative keywords. It turns competitive analysis directly into faster, smarter campaign growth.
Going Beyond the Basics: Advanced Tactics and Pitfalls to Sidestep
Alright, so you’ve got the fundamentals down. Now it’s time to really dig in and start using the Auction Insights report like the pros do. This means getting past a quick glance at the main numbers and starting to see the story the data is telling you about your competitors' game plan.
Think of it this way: the basic report is like seeing a single play in a football game. Advanced analysis is like getting your hands on the other team's entire playbook. You're not just reacting anymore; you're anticipating their next move and finding the gaps in their strategy to give your own campaigns a real advantage.
Slice and Dice Your Report for a Clearer Picture
One of the most powerful, yet criminally underused, features in the report is segmentation. If you're just looking at the top-level data, you're looking at an average. And averages lie. They smooth over the critical details and hide the real trends. By slicing the data, you can uncover exactly what your competitors are up to.
Segment by Device: Is a rival bidding like crazy on mobile but barely showing up on desktop? Maybe you'll find someone owns the desktop search results during the 9-to-5 workday, while another competitor is cleaning up on mobile over the weekend. Seeing this lets you get smart with your own device bid adjustments, putting your money where it has the best shot of winning.
Segment by Time: Breaking the report down by day of the week, or even hour of the day, can be incredibly revealing. If you spot a major competitor’s Impression Share suddenly nosedive after 5 PM, that’s a golden opportunity. It could mean their daily budget is tapped out, leaving the field wide open for you to ramp up your bids and grab all that evening traffic.
Without segmentation, you’re looking at a blurry photo of the auction. When you segment, you’re watching a high-definition video. You can see exactly when and where your rivals are making their moves—and where they're vulnerable.
Look for the Story Over Time
A single Auction Insights report is just a snapshot, a single moment in time. The real magic happens when you start comparing these reports week after week, month after month. This isn't a "set it and forget it" tool.
Make it a routine to check in—maybe weekly or every two weeks—and document the shifts. Is a new player slowly creeping up the ranks and eating into your Outranking Share? Is a long-standing competitor's presence fading, maybe hinting at budget cuts? Tracking these changes helps you tell the difference between a one-off test on their end and a major strategic shift, so you can respond with a calculated plan instead of a panicked reaction.
Common Budget-Burning Mistakes to Avoid
Knowing what to do is half the battle. Knowing what not to do is the other half. Even seasoned advertisers can fall into a few common traps when looking at this data, turning valuable insights into costly mistakes.
Here are the biggest blunders to watch out for:
The One-Competitor Obsession: It’s so easy to get laser-focused on that one main rival. But this tunnel vision can drag you into a pointless and expensive bidding war while you completely miss other threats or opportunities. Your goal is overall market position and profitability, not just a personal victory over one company's Position Above Rate.
The Knee-Jerk Bid Reaction: Seeing a competitor jump above you stings. Your first instinct might be to just throw more money at your bids. Don't. Before you do anything, dig into the why. Is their Quality Score better? Is their ad copy just that much more compelling? A bid increase should be a last resort, not a first response.
Forgetting Your Own Bottom Line: The Auction Insights report is all about your competitors. It tells you nothing about what actually matters: your conversions and your return on investment. Who cares if you win the #1 spot if those clicks never turn into paying customers? Always, always look at this data next to your own performance metrics to make sure your competitive strategy is actually making you money.
Building a Repeatable Auction Analysis Workflow
Raw data is just noise. It’s a jumble of numbers until you give it a purpose. A one-time peek at the auction insights in Adwords report is interesting, sure, but turning that peek into a consistent, scheduled process is what separates the good PPC managers from the great ones. When you build a repeatable workflow, this tool transforms from a reactive diagnostic into a proactive strategic weapon.
The goal is to stop treating competitive analysis like an emergency procedure you only run when performance tanks. Instead, think of it as a regular health check for your campaigns. This discipline ensures you’re always on top of the competitive environment, ready to adapt your strategy before a small shift blows up into a major problem.
Establishing a Cadence for Review
Consistency is your best friend here. You don’t need to live inside this report every single day, but you absolutely need a rhythm. A simple, structured review process helps you spot trends instead of just reacting to random, day-to-day fluctuations.
Here’s a practical schedule you can steal:
- Weekly Check-in (5-10 Minutes): This is perfect for your high-spend or hyper-competitive campaigns. You're just doing a quick scan for major red flags. Did a new competitor suddenly grab a huge Impression Share? Did your Outranking Share plummet against a key rival? This is your early warning system.
- Monthly Deep Dive (30-45 Minutes): This is where the real strategic work happens. Compare month-over-month data to see the bigger picture. Is a competitor getting more aggressive over time? Are your bidding optimizations actually improving your Position Above Rate?
A Simple Analysis Checklist
To make this process efficient, don't just wander through the data hoping for an epiphany. Go in with a clear checklist of questions you need to answer. This keeps your analysis focused and, more importantly, actionable.
Your monthly review could follow these steps:
- Spot New Players: Are there any new domains in the report this month that weren't there last month? Keep an eye on them.
- Track Key Rivals: How have your Outranking Share and Position Above Rate changed against your top 2-3 competitors? Are you gaining ground or losing it?
- Check Your Impression Share: Look for any significant drops. If you see one, immediately cross-reference it with your "Impression Share Lost (Budget)" and "Impression Share Lost (Rank)" columns to figure out why it dropped.
- Jot Down Your Findings: Keep a simple log. Something like, "Competitor X increased Impression Share by 15% this month, probably bidding up." This history becomes gold over time.
By creating this structured workflow, you build a historical record of the competitive landscape. This documentation allows you to connect your actions to outcomes, demonstrating clear value to stakeholders or clients by showing how your strategic adjustments are directly impacting your market position.
This systematic approach is the bedrock of a solid paid search analysis strategy. It ensures you’re not just managing campaigns, but actively steering them with a clear view of the road ahead—and all the other cars on it.
Your Top Auction Insights Questions, Answered
Even after you've got a handle on the metrics, a few questions always seem to come up when you first start digging into the auction insights in Adwords report. Let's tackle some of the most common ones so you can navigate this powerful tool like a pro.
Why Can't I See The Auction Insights Report?
This is a classic, especially for new campaigns. If you're clicking around and can't find the report, don't panic. It almost always means your campaign, ad group, or keyword just hasn't been in enough auctions yet. Google needs a certain amount of data to make the report meaningful.
The solution is simple: patience. Give your campaign a little more time to run and gather data. Once it's participated in enough auctions, the report will pop right up.
How Often Should I Check My Auction Insights?
There’s no magic number here, but finding a good rhythm is everything. For most advertisers, a weekly or bi-weekly check-in is the sweet spot. This schedule lets you spot meaningful trends without getting lost in the weeds of daily fluctuations.
Of course, if you're running a massive campaign or you're in a super-competitive niche, you might need to peek in more often to keep tabs on aggressive competitors.
The goal isn't to stare at it all day. It's about building a consistent habit. You're looking for patterns that emerge over weeks and months, not reacting to every little blip on the radar.
Should I Aim For A 100% Impression Share?
I know it's tempting. That 100% looks like a perfect score, right? But the short answer is a hard no.
Chasing that perfect score is usually a surefire way to burn through your budget. The cost to capture those last few percentage points can get astronomical, pushing your cost-per-acquisition way into the red. Think of Impression Share as a health check, not the end goal. Your profitability and return on ad spend are what really matter.
Can I See My Competitors' Exact Bids?
Nope, and that’s a good thing. Google built the Auction Insights report with advertiser privacy in mind. It will never show you another advertiser's specific bids, Quality Score, daily budget, or any other secret sauce from their account.
What it does give you are the performance outcomes. You can see how you're stacking up against them in the real world, which lets you make some very educated guesses about their strategy without ever seeing their settings.
Ready to turn these competitive insights into faster, smarter campaign growth? keywordme helps you clean up junk search terms, expand ad groups with winning keywords, and optimize your entire account up to 10x faster. Start your free 7-day trial and see the difference.